Démographie des États-Unis
Les États-Unis avaient une population résidente officielle de 331 893 745 au 1er juillet 2021, selon le US Census Bureau . [1] Ce chiffre comprend les 50 États et le district de Columbia, mais exclut la population de cinq territoires américains non constitués en société ( Porto Rico , Guam , les Îles Vierges américaines , les Samoa américaines et les îles Mariannes du Nord ) ainsi que plusieurs possessions insulaires mineures. Les États-Unis sont le troisième pays le plus peuplé du monde. [12]Le Census Bureau a montré une augmentation de la population de 0,8% pour la période de douze mois se terminant en juillet 2012. Bien que élevé par rapport aux normes des pays industrialisés, ce taux est inférieur au taux annuel moyen mondial de 1,1%. [13] L’ indice synthétique de fécondité aux États-Unis estimé pour 2020 est de 1,638 enfants par femme, [5] ce qui est inférieur au taux de fécondité de remplacement d’environ 2,1.
| Démographie des États-Unis | |
|---|---|
 Pyramide des âges des États-Unis au 1er décembre 2020 Pyramide des âges des États-Unis au 1er décembre 2020 |
|
| Population | |
| Densité | 86,16/mi carré (33,27/km 2 ) |
| Taux de croissance | |
| Taux de natalité | 10,9 naissances/1 000 habitants (2020) [2] |
| Taux de mortalité | 10,2 décès/1 000 habitants (2020) [2] |
| Espérance de vie | |
| • Masculin | |
| • femelle | |
| Taux de fécondité | 1.641 enfants nés/femme (2020) [5] |
| Taux de migration nette | 3 migrant(s)/1 000 habitants (2020) [2] |
| Pyramide des ages | |
| Moins de 18 ans | 24,0 % (2010) [6] |
| 18–44 ans | 36,5 % (2010) [6] |
| 45–64 ans | 26,4 % (2010) [6] |
| 65 ans et plus | 13,0 % (2010) [6] |
| Langue | |
| Officiel | Pas de langue officielle au niveau national. L’anglais est désigné officiel dans 32 des 50 états (et les 5 territoires américains ). L’hawaïen est officiel à Hawaï , 20 langues autochtones sont officielles en Alaska et le sioux est officiel dans le Dakota du Sud . [7] Le samoan est une langue officielle aux Samoa américaines , [8] Le chamorro est une langue officielle à Guam , [9] Le chamorro et le carolinien sont des langues officielles dans les îles Mariannes du Nord , [10]et l’espagnol est une langue officielle à Porto Rico . [11] |
| Parlé |
|
| Source : Le World Factbook [2] |
La population américaine a presque quadruplé au cours du 20e siècle – à un taux de croissance d’environ 1,3 % par an – passant d’environ 76 millions en 1900 à 281 millions en 2000. [14] On estime qu’elle a atteint la barre des 200 millions en 1967, et la barre des 300 millions le 17 octobre 2006. [14] [15] L’immigration née à l’étranger a entraîné une augmentation rapide de la population américaine, la population née à l’étranger doublant de près de 20 millions en 1990 à plus de 45 millions en 2015, [16] représentant un tiers de l’augmentation de la population. [17] La population américaine a augmenté de 1,6 million entre 2018 et 2019, dont 38 % de croissance due à l’immigration. [18]La croissance démographique est la plus rapide parmi les minorités dans leur ensemble, et selon l’estimation du Bureau du recensement pour 2020, 50 % des enfants américains de moins de 18 ans sont membres de groupes ethniques minoritaires . [19]
En 2020, les Blancs (y compris les Blancs hispaniques) étaient au nombre de 204277273 ou 61,6% de la population et les Blancs non latinos représentaient 57,8% de la population du pays. [20]
Les Latino-Américains ont représenté 48 % de la croissance démographique nationale de 2,9 millions entre le 1er juillet 2005 et le 1er juillet 2006 . . [22]
Le Census Bureau prévoit une population américaine de 417 millions en 2060, une augmentation de 38 % par rapport à 2007 (301,3 millions), [23] et les Nations Unies estiment que les États-Unis seront parmi les neuf pays responsables de la moitié de la croissance démographique mondiale d’ici 2050. , [24] avec sa population étant 402 millions d’ici là (une augmentation de 32 % de 2007). [25] Dans un rapport de recensement officiel, il a été signalé que 54,4 % des naissances en 2010 (2 150 926 sur 3 953 593) étaient de « blancs non latinos ». Cela représente une augmentation de 0,3 % par rapport à l’année précédente, qui était de 54,1 %. [26]
Population
 Comtés aux États-Unis par population par mile carré de superficie terrestre selon l’ enquête sur la communauté américaine du US Census Bureau 2013–2017 5-Year Estimates et le recensement des États-Unis de 2010 . [27] [28] Les comtés plus densément peuplés que les États-Unis dans leur ensemble sont entièrement bleus.
  États et territoires des États-Unis par population par mile carré, selon le recensement des États-Unis de 2020 .
  Comtés aux États-Unis par croissance démographique depuis 2010 selon l’estimation annuelle 2018 de la population résidente du US Census Bureau. [29] Les comtés avec une croissance démographique supérieure à celle des États-Unis dans leur ensemble sont en vert foncé, les comtés avec une croissance démographique plus lente que les États-Unis en vert clair et les comtés avec une population en déclin en rouge clair.
  États des États-Unis par croissance démographique depuis 2010 selon l’estimation annuelle 2018 de la population résidente du US Census Bureau. [29] Les États dont la croissance démographique est supérieure à celle des États-Unis dans leur ensemble sont en vert foncé, les États dont la croissance démographique est plus lente que les États-Unis en vert clair et les États dont la population diminue en rouge clair.
Au 1er avril 2020, les États-Unis comptaient 331 449 281 habitants. [30]
Les statistiques démographiques suivantes proviennent du CIA World Factbook estimées à partir de 2018 [update], [2] sauf indication contraire.
Remarque : Estimation de la population des États-Unis hors forces armées d’outre-mer. [31] [32]
Répartition par âge et sexe
 Proportion d’Américains de moins de 18 ans dans chaque comté des cinquante États , le district de Columbia et Porto Rico au recensement des États-Unis de 2020
| années d’âge) | total (en milliers) | % de la population américaine. | hommes (en milliers) | femmes (en milliers) | % Masculin | % femelle | homme Femme |
|---|---|---|---|---|---|---|---|
| < 15 | 60 774 | 18,7 % | 31 072 | 29 703 | 51,1 % | 48,9 % | 1.05 |
| 15-17 | 13 018 | 4,0 % | 6 656 | 6 363 | 51,1 % | 48,9 % | 1.05 |
| 18-20 | 11 851 | 3,7 % | 5 931 | 5 920 | 50% | 50% | 1,00 |
| 21-44 | 103 469 | 31,9 % | 51 658 | 51 811 | 49,9 % | 50,1 % | 1,00 |
| 45-64 | 82 455 | 25,4 % | 39 789 | 42 666 | 48,3 % | 51,7 % | 0,93 |
| 65+ | 52 788 | 16,3 % | 23 923 | 28 865 | 45,3 % | 54,7 % | 0,83 |
| tout | 324 356 | 100% | 159 028 | 165 328 | 49% | 51% | 0,96 |
*membres des ménages civils, y compris les forces armées hors poste ou avec leurs familles en poste
L’ âge médian de la population totale est de 38,3 ans; l’âge médian masculin est de 37,1 ans; l’âge médian des femmes est de 39,5 ans.
Taux de natalité
- 11,0 naissances/1 000 habitants (2020) [34] Comparaison des pays avec le monde : 157e
Taux de mortalité
- 10,27 décès/1 000 habitants (estimation 2020) Comparaison des pays avec le monde : 86e [35]
- 8,35 décès/1 000 habitants (2020 est)* [4] *taux de mortalité ajusté selon l’âge
Taux de fécondité total
En 1800, la femme américaine moyenne avait 7,04 enfants ; [36] dans la première décennie des années 1900, ce nombre était déjà tombé à 3,56. [37] Depuis le début des années 1970, le taux de natalité est inférieur au taux de remplacement de 2,1 avec 1,73 enfant par femme en 2018. [38]
La baisse du taux de fécondité aux États-Unis de 2,08 par femme en 2007 à 1,76 en 2017 était principalement due à la baisse du taux de natalité des Hispaniques, des adolescentes et des jeunes femmes, bien que le taux de natalité des femmes plus âgées ait augmenté. [39]
- 1.641 enfants nés/femme (2020). [34]
Âge moyen de la mère à la première naissance
- 27,1 ans (est. 2020) [34]
Espérance de vie
 Évolution historique de l’espérance de vie
- Population totale : 77,3 ans pour un enfant né en 2020, contre 78,8 ans en 2019. [3]
- Homme : 74,5 ans (2020), 76,3 ans (2019)
- Femme : 80,2 ans (2020), 81,4 ans (2019)
L’espérance de vie moyenne aux États-Unis est en baisse depuis 2014. Les Centers for Disease Control and Prevention citent trois raisons principales : une augmentation de 72 % des surdoses au cours de la dernière décennie (dont une augmentation de 30 % des surdoses d’opioïdes à partir de juillet 2016 à septembre 2017, mais ne distinguait pas un surdosage accidentel avec une prescription légale et un surdosage avec des opioïdes obtenus illégalement et/ou combinés avec des drogues illégales, c’est-à-dire l’héroïne, la cocaïne, la méthamphétamine, etc.), une augmentation sur dix ans des maladies du foie (le chez les hommes de 25 à 34 ans a augmenté de 8 % par an ; chez les femmes, de 11 % par an), et une augmentation de 33 % des taux de suicide depuis 1999. [40]
De 2019 à 2020, la pandémie de COVID-19 a contribué à environ 74 % de la diminution de l’espérance de vie aux États-Unis. [41]
Tables de mortalité
| Table de mortalité des États-Unis, 2018 [42] | ||||
| Femelles | Mâles | |||
| Âge | Cohorte | Espérance de vie | Cohorte | Espérance de vie |
| 0 | 100 000 | 81.2 | 100 000 | 76,2 |
| 1 | 99 494 | 80,7 | 99 379 | 75,7 |
| 5 | 99 412 | 76,7 | 99 269 | 71,8 |
| dix | 99 360 | 71,8 | 99 207 | 66,8 |
| 15 | 99 296 | 66,8 | 99 124 | 61,9 |
| 20 | 99 151 | 61,9 | 98 785 | 57.1 |
| 25 | 98 913 | 57,0 | 98 144 | 52,4 |
| 30 | 98 578 | 52.2 | 97 345 | 47,8 |
| 35 | 98 122 | 47,5 | 96 425 | 43.3 |
| 40 | 97 527 | 42,7 | 95 335 | 38,7 |
| 45 | 96 747 | 38.1 | 94 037 | 34.2 |
| 50 | 95 606 | 33,5 | 92 225 | 29,9 |
| 55 | 93 872 | 29,0 | 89 528 | 25,7 |
| 60 | 91 298 | 24,8 | 85 497 | 21.8 |
| 65 | 87 747 | 20.7 | 79 949 | 18.1 |
| 70 | 82 867 | 16.8 | 72 825 | 14.6 |
| 75 | 75 660 | 13.1 | 63 633 | 11.3 |
| 80 | 65 003 | 9.8 | 51 305 | 8.4 |
| 85 | 49 763 | 7.0 | 35 806 | 6.0 |
| 90 | 30 654 | 4.8 | 18 995 | 4.1 |
| 95 | 12 591 | 3.2 | 6 219 | 2.8 |
| 100 | 2 727 | 2.2 | 1 003 | 2.0 |
Densité
L’État le plus densément peuplé est le New Jersey (1 121/mi 2 ou 433/km 2 ).
La population est fortement urbanisée, avec 82,3% de la population résidant dans les villes et les banlieues. [2] Les grandes grappes urbaines sont réparties dans toute la moitié orientale des États-Unis (en particulier la région des Grands Lacs, au nord-est, à l’est et au sud-est) et dans les États de la tranche ouest ; les régions montagneuses, principalement les montagnes Rocheuses et la chaîne des Appalaches, les déserts du sud-ouest, les forêts boréales denses de l’extrême nord et les États des prairies centrales sont moins densément peuplés; La population de l’Alaska est concentrée le long de sa côte sud – avec un accent particulier sur la ville d’ Anchorage – et celle d’Hawaï est centrée sur l’île d’Oahu. [2] La Californie et le Texas sont les États les plus peuplés, carle centre moyen de la population américaine s’est constamment déplacé vers l’ouest et le sud. [43] [44] La ville de New York est la ville la plus peuplée des États-Unis [45] et ce depuis au moins 1790 .
Dans les territoires américains , les centres de population comprennent la région métropolitaine de San Juan à Porto Rico , [46] Saipan dans les îles Mariannes du Nord , [47] et l’île de Tutuila dans les Samoa américaines . [48]
Croissance
- Taux de croissance démographique : 0,8 %. Comparaison des pays au monde : 130e
Naissances et fécondité selon la race
personnes nées aux États-Unis
Remarque : les Hispaniques sont comptés à la fois par leur origine ethnique et par leur race, ce qui donne un nombre global plus élevé. Notez également que les flèches de croissance indiquent une augmentation ou une diminution du nombre de naissances, et non du taux de fécondité. [49] [50] [51] [52]
| Race de mère | Nombre de naissances en 2016 |
% de tous les nés |
ISF (2016) |
Nombre de naissances en 2017 |
% de tous les nés |
ISF (2017) |
Nombre de naissances en 2018 |
% de tous les nés |
ISF (2018) |
Nombre de naissances en 2019 |
% de tous les nés |
ISF (2019) |
Nombre de naissances en 2020 |
% de tous les nés |
ISF (2020) |
2020-2016
|
|---|---|---|---|---|---|---|---|---|---|---|---|---|---|---|---|---|
| Blanc | 2 900 933 | 73,5 % | 1,77 | 2 812 267 | 72,9 % | 1,76 | 2 788 439 | 73,5 % | 1,75 | |||||||
| > NH Blanc | 2 056 332 | 52,1 % | 1.719 | 1 992 461 | 51,7 % | 1.666 | 1 956 413 | 51,6 % | 1.640 | 1 915 912 | 51,1 % | 1.611 | 1 843 432 | 51,0 % | 1.552 | |
| Le noir | 623 886 | 15,8 % | 1,90 | 626 027 | 16,2 % | 1,92 | 600 933 | 15,8 % | 1,87 | |||||||
| > NH Noir | 558 622 | 14,2 % | 1.832 | 560 715 | 14,5 % | 1.824 | 552 029 | 14,6 % | 1.792 | 548 075 | 14,6 % | 1.776 | 529 811 | 14,7 % | 1.714 | |
| NH Asiatique | 254 471 | 6,5 % | 1.690 | 249 250 | 6,5 % | 1.597 | 240 798 | 6,4 % | 1.525 | 238 769 | 6,4 % | 1.511 | 219 068 | 6,1 % | 1.385 | |
| NH Amérindien ou natif de l’Alaska | 31 452 | 0,8 % | 1.794 | 29 957 | 0,8 % | 1.702 | 29 092 | 0,8 % | 1.651 | 28 450 | 0,76 % | 1.612 | 26 813 | 0,74 % | 1.517 | |
| NH Hawaiian (y compris les autres insulaires du Pacifique) | 9 342 | 0,2 % | 2.076 | 9 426 | 0,2 % | 2.085 | 9 476 | 0,3 % | 2.106 | 9 770 | 0,26 % | 2.178 | 9 626 | 0,26 % | 2.142 | |
| Total | 3 945 875 | 100% | 1.820 | 3 855 500 | 100% | 1.765 | 3 791 712 | 100% | 1.729 | 3 747 540 | 100% | 1.706 | 3 613 647 | 100% | 1.641 | |
REMARQUE :
- NH = Non hispanique.
- ISF = Indice synthétique de fécondité (nombre d’enfants nés par femme).
- Flèches de croissance (
![Increase]()
![Increase]() /
/ ![Decrease]()
![Decrease]() ) indiquent une augmentation ou une diminution du nombre de naissances, et non du taux de fécondité, par rapport à l’année précédente.
) indiquent une augmentation ou une diminution du nombre de naissances, et non du taux de fécondité, par rapport à l’année précédente.
| Ethnie de la mère | Nombre de naissances en 2016 |
ISF (2016) |
Nombre de naissances en 2017 |
ISF (2017) |
Nombre de naissances en 2018 |
ISF (2018) |
Nombre de naissances en 2019 |
ISF (2019) |
Nombre de naissances en 2020 |
ISF (2020) |
2020-2016
|
|---|---|---|---|---|---|---|---|---|---|---|---|
| Non hispanique (de toute race) | 3 027 428 | 2 956 736 | 2 905 502 | 2 861 073 | 2 746 933 | |
|||||
| Hispanique (de toute race) | 918 447 | 2.093 | 898 764 | 2.007 | 886 210 | 1.959 | 886 467 | 1.940 | 866 714 | 1.876 | |
| Course | 2008 | 2011 | 2013 | ||||||||
| Blanc | 2.29 | 2.01 | 1,94 | ||||||||
| Le noir | 2.51 | 2,57 | 2.35 | ||||||||
| asiatique | 2.25 | 2.02 | 1,93 | ||||||||
| Autre | 1,80 | 2.04 | 2.06 | ||||||||
| Hispanique (de toute race) | 3.15 | 2,77 | 2.46 | ||||||||
| Total | 2,75 | 2,45 | 2.22 |
Immigration
En 2017, sur la population américaine née à l’étranger, quelque 45 % (20,7 millions) étaient des citoyens naturalisés, 27 % (12,3 millions) étaient des résidents permanents légaux (dont de nombreux éligibles à devenir citoyens), 6 % (2,2 millions) étaient des résidents temporaires. résidents légaux et 23 % (10,5 millions) étaient des immigrants non autorisés. [54] Parmi les immigrants vivants actuels aux États-Unis, les cinq principaux pays de naissance sont le Mexique (25 % des immigrants), la Chine (6 %), l’Inde (6 %), les Philippines (5 %) et le Salvador (3 % ). Environ 13 % des immigrants vivants actuels viennent d’Europe et du Canada, et 10 % des Caraïbes. [54] Parmi les nouveaux arrivants, les immigrés asiatiques sont plus nombreux que les immigrés hispaniques depuis 2010 ; en 2017, 37,4 % des arrivées d’immigrants étaient asiatiques et 26,6 % étaient hispaniques. [54]Jusqu’en 2017 et 2018, les États-Unis étaient en tête du monde en matière de réinstallation de réfugiés pendant des décennies, admettant plus de réfugiés que le reste du monde réuni. [55] De l’exercice 1980 à 2017, 55 % des réfugiés sont venus d’Asie, 27 % d’Europe, 13 % d’Afrique et 4 % d’Amérique latine, fuyant la guerre et la persécution. [55]
- Taux de migration nette : 0,8 migrants/1 000 habitants (estimation de 2021) [56] Comparaison des pays avec le monde : 35e [ citation nécessaire ]
- Taux de migration nette : 3,9 migrants/1 000 habitants (estimation de 2017) [ citation nécessaire ]
En 2017, 13,6% (44,4 millions) de la population était née à l’étranger – une augmentation par rapport à 4,7% en 1970 mais moins que le record de 1890 de 14,8%. 45% de la population née à l’étranger étaient des citoyens américains naturalisés. 23% (10,3 millions) de la communauté née à l’étranger est sans papiers , ce qui représente 3,2% de la population totale. [57] Selon le recensement de 2010, l’Amérique latine et les Caraïbes constituent le plus grand groupe de régions de naissance, représentant 53 % de la population née à l’étranger. En 2018, cette région est toujours la plus grande source d’immigrants aux États-Unis [58] [59] [60] En 2018, il y avait près de 90 millions d’immigrants et d’enfants d’immigrants nés aux États-Unis ( deuxième génération ).Américains) aux États-Unis, représentant 28 % de la population totale des États-Unis. [61] En 2018, 1 096 611 immigrants ont obtenu la résidence légale permanente ou temporaire aux États-Unis [62]
| Pays | 2020 |
|---|---|
| Mexique | 100 325 |
| Inde | 46 363 |
| Chine | 41 483 |
| République dominicaine | 30 005 |
| Viêt Nam | 29 995 |
| Philippines | 25 491 |
| Le Salvador | 17 907 |
| Brésil | 16 746 |
| Cuba | 16 367 |
| Corée du Sud | 16 244 |
| Région | 2020 |
| Asie | 272 597 |
| Amériques | 284 491 |
| Afrique | 76 649 |
| L’Europe | 68 994 |
| Océanie | 3 998 |
| Non précisé | 633 |
| Total | 707 362 |
| Classe d’admission (Ajustements de statut et nouveaux arrivants) | 2020 |
| Parents immédiats de citoyens américains | 321 148 |
| Préférences parrainées par la famille | 121 560 |
| Préférences fondées sur l’emploi | 148 959 |
| Diversité | 25 028 |
| Réfugiés | 44 404 |
| Asilés | 19 471 |
| Libérés conditionnels | 13 |
| Enfants nés à l’étranger de résidents étrangers | 30 |
| Certains Irakiens et Afghans employés par le gouvernement américain et leurs conjoints et enfants | 9 727 |
| Annulation du retrait | 3 685 |
| Victimes de la traite des êtres humains | 866 |
| Victimes d’actes criminels et leurs conjoints et enfants | 11 937 |
| Autre | 534 |
Statistiques de l’état civil
Tableau démographique des États-Unis, 1935-2021
| Population moyenne [64] [31] [32] | Naissances vivantes [65] | Décès | Changement naturel | Taux brut de natalité (pour 1 000) | Taux brut de mortalité (pour 1 000) [66] | Changement naturel (pour 1 000) | Indice synthétique de fécondité [fn 1] [67] | |
|---|---|---|---|---|---|---|---|---|
| 1935 | 127 250 000 | 2 377 000 | 1 392 752 | 984 248 | 18.7 | 10.9 | 7.7 | 2.19 |
| 1936 | 128 053 000 | 2 355 000 | 1 479 228 | 875 772 | 18.4 | 11.5 | 6.8 | 2.15 |
| 1937 | 128 825 000 | 2 413 000 | 1 450 427 | 962 573 | 18.7 | 11.2 | 7.5 | 2.17 |
| 1938 | 129 825 000 | 2 496 000 | 1 381 391 | 1 114 609 | 19.2 | 10.6 | 8.6 | 2.22 |
| 1939 | 130 880 000 | 2 466 000 | 1 387 897 | 1 078 103 | 18.8 | 10.6 | 8.2 | 2.17 |
| 1940 | 131 930 000 | 2 559 000 | 1 417 269 | 1 142 000 | 19.4 | 10.8 | 8.7 | 2.301 |
| 1941 | 133 058 000 | 2 703 000 | 1 397 642 | 1 305 358 | 20.3 | 10.5 | 9.8 | 2.399 |
| 1942 | 133 752 000 | 2 989 000 | 1 385 187 | 1 603 813 | 22.2 | 10.3 | 12 | 2.628 |
| 1943 | 133 971 000 | 3 104 000 | 1 459 544 | 1 644 306 | 22,8 | 10.7 | 12.3 | 2.718 |
| 1944 | 132 622 000 | 2 939 000 | 1 411 338 | 1 644 456 | 21.2 | 10.2 | 12.4 | 2.568 |
| 1945 | 132 137 000 | 2 858 000 | 1 401 719 | 1 456 281 | 20.4 | 11 | 11 | 2.491 |
| 1946 | 139 893 000 | 3 411 000 | 1 395 617 | 2 015 383 | 24.1 | 10.0 | 14.4 | 2.943 |
| 1947 | 143 375 000 | 3 817 000 | 1 445 370 | 2 371 630 | 26.6 | 10.0 | 16.5 | 3.274 |
| 1948 | 146 045 000 | 3 637 000 | 1 444 337 | 2 192 663 | 24,9 | 9.8 | 15 | 3.109 |
| 1949 | 148 558 000 | 3 649 000 | 1 443 607 | 2 205 393 | 24,5 | 9.7 | 14.8 | 3.110 |
| 1950 | 151 240 000 | 3 632 000 | 1 452 454 | 2 180 000 | 24.1 | 9.6 | 14.4 | 3.091 |
| 1951 | 153 384 000 | 3 823 000 | 1 482 099 | 2 340 901 | 24,8 | 9.6 | 15.3 | 3.269 |
| 1952 | 155 761 000 | 3 913 000 | 1 496 838 | 2 416 162 | 25,0 | 9.6 | 15.5 | 3.358 |
| 1953 | 158 313 000 | 3 965 000 | 1 447 459 | 2 517 541 | 25.2 | 9.1 | 15.9 | 3.424 |
| 1954 | 161 191 000 | 4 078 000 | 1 481 091 | 2 596 909 | 24,8 | 9.3 | 16.1 | 3.543 |
| 1955 | 164 302 000 | 4 097 000 | 1 528 717 | 2 568 283 | 25,0 | 9.3 | 15.6 | 3.580 |
| 1956 | 167 261 000 | 4 218 000 | 1 564 476 | 2 653 524 | 25.1 | 9.3 | 15.9 | 3.689 |
| 1957 | 170 295 000 | 4 308 000 | 1 633 128 | 2 666 872 | 25.3 | 9.5 | 15.7 | 3.767 |
| 1958 | 173 239 000 | 4 255 000 | 1 647 886 | 2 607 114 | 24.4 | 9.5 | 15 | 3.701 |
| 1959 | 176 511 000 | 4 244 796 | 1 656 814 | 2 587 982 | 24.0 | 9.4 | 14.7 | 3.670 |
| 1960 | 179 977 000 | 4 257 850 | 1 711 982 | 2 545 868 | 23,7 | 9.5 | 14.1 | 3.654 |
| 1961 | 182 953 000 | 4 268 326 | 1 701 522 | 2 566 804 | 23.3 | 9.3 | 14.0 | 3.629 |
| 1962 | 185 771 000 | 4 167 362 | 1 756 720 | 2 410 642 | 22.4 | 9.5 | 13 | 3.474 |
| 1963 | 188 483 000 | 4 098 020 | 1 813 549 | 2 284 471 | 21.7 | 9.6 | 12.1 | 3.333 |
| 1964 | 191 141 000 | 4 027 490 | 1 798 051 | 2 229 439 | 21.1 | 9.4 | 11.7 | 3.208 |
| 1965 | 193 526 000 | 3 760 358 | 1 828 136 | 1 932 222 | 19.4 | 9.5 | 9.9 | 2.928 |
| 1966 | 195 576 000 | 3 606 274 | 1 863 149 | 1 743 125 | 18.4 | 9.5 | 8.9 | 2.736 |
| 1967 | 197 457 000 | 3 520 959 | 1 851 323 | 1 669 636 | 17.8 | 9.4 | 8.4 | 2.578 |
| 1968 | 199 399 000 | 3 501 564 | 1 930 082 | 1 571 482 | 17.6 | 9.7 | 7.9 | 2.477 |
| 1969 | 201 385 000 | 3 600 206 | 1 921 990 | 1 678 216 | 17.9 | 9.5 | 8.4 | 2.465 |
| 1970 | 203 984 000 | 3 731 386 | 1 921 031 | 1 810 355 | 18.4 | 9.4 | 9.0 | 2.480 |
| 1971 | 206 827 000 | 3 555 970 | 1 927 542 | 1 628 428 | 17.2 | 9.3 | 7.9 | 2.266 |
| 1972 | 209 284 000 | 3 258 411 | 1 963 944 | 1 294 467 | 15.6 | 9.4 | 6.2 | 2.010 |
| 1973 | 211 357 000 | 3 136 965 | 1 973 003 | 1 163 962 | 14.8 | 9.5 | 5.3 | 1.879 |
| 1974 | 213 342 000 | 3 159 958 | 1 934 388 | 1 225 570 | 14.8 | 9.1 | 5.7 | 1.835 |
| 1975 | 215 465 000 | 3 144 198 | 1 892 879 | 1 251 319 | 14.6 | 8.8 | 5.8 | 1.774 |
| 1976 | 217 563 000 | 3 167 788 | 1 909 440 | 1 258 348 | 14.6 | 8.8 | 5.8 | 1.738 |
| 1977 | 219 760 000 | 3 326 632 | 1 899 597 | 1 427 035 | 15.1 | 8.6 | 6.5 | 1.789 |
| 1978 | 222 095 000 | 3 333 279 | 1 927 788 | 1 405 491 | 15,0 | 8.7 | 6.3 | 1.760 |
| 1979 | 224 567 000 | 3 494 398 | 1 913 841 | 1 580 557 | 15.6 | 8.5 | 7.1 | 1.808 |
| 1980 | 227 225 000 | 3 612 258 | 1 989 841 | 1 622 417 | 15.9 | 8.8 | 7.1 | 1.839 |
| 1981 | 229 466 000 | 3 629 238 | 1 977 981 | 1 651 257 | 15.8 | 8.6 | 7.2 | 1.812 |
| 1982 | 231 664 000 | 3 680 537 | 1 974 797 | 1 705 740 | 15.9 | 8.5 | 7.4 | 1.827 |
| 1983 | 233 792 000 | 3 638 933 | 2 019 201 | 1 619 732 | 15.6 | 8.6 | 6.9 | 1.799 |
| 1984 | 235 825 000 | 3 669 141 | 2 039 369 | 1 629 772 | 15.6 | 8.6 | 6.9 | 1.806 |
| 1985 | 237 924 000 | 3 760 561 | 2 086 440 | 1 674 121 | 15.8 | 8.8 | 7.0 | 1.844 |
| 1986 | 240 133 000 | 3 756 547 | 2 105 361 | 1 651 186 | 15.6 | 8.8 | 6.9 | 1.837 |
| 1987 | 242 289 000 | 3 809 394 | 2 123 323 | 1 686 071 | 15.7 | 8.8 | 7.0 | 1.872 |
| 1988 | 244 499 000 | 3 909 510 | 2 167 999 | 1 741 511 | 16.0 | 8.9 | 7.1 | 1.934 |
| 1989 | 246 819 000 | 4 040 958 | 2 150 466 | 1 890 492 | 16.4 | 8.7 | 7.7 | 2.014 |
| 1990 | 249 623 000 | 4 158 212 | 2 148 463 | 2 009 749 | 16.7 | 8.6 | 8.1 | 2.081 |
| 1991 | 252 981 000 | 4 110 907 | 2 169 518 | 1 941 389 | 16.2 | 8.6 | 7.7 | 2.062 |
| 1992 | 256 514 000 | 4 065 014 | 2 175 613 | 1 889 401 | 15.8 | 8.5 | 7.4 | 2.046 |
| 1993 | 259 919 000 | 4 000 240 | 2 268 553 | 1 731 687 | 15.4 | 8.7 | 6.7 | 2.019 |
| 1994 | 263 126 000 | 3 952 767 | 2 278 994 | 1 673 773 | 15,0 | 8.7 | 6.4 | 2.001 |
| 1995 | 266 278 000 | 3 899 589 | 2 312 132 | 1 587 457 | 14.6 | 8.7 | 6.0 | 1.978 |
| 1996 | 269 394 000 | 3 891 494 | 2 314 690 | 1 576 804 | 14.4 | 8.6 | 5.9 | 1.976 |
| 1997 | 272 647 000 | 3 880 894 | 2 314 245 | 1 566 649 | 14.2 | 8.5 | 5.7 | 1.971 |
| 1998 | 275 854 000 | 3 941 553 | 2 337 256 | 1 604 297 | 14.3 | 8.5 | 5.8 | 1.999 |
| 1999 | 279 040 000 | 3 959 417 | 2 391 399 | 1 568 018 | 14.2 | 8.6 | 5.6 | 2.007 |
| 2000 | 282 172 000 | 4 058 814 | 2 403 351 | 1 655 463 | 14.4 | 8.5 | 5.9 | 2.056 |
| 2001 | 285 082 000 | 4 025 933 | 2 416 425 | 1 609 508 | 14.1 | 8.5 | 5.6 | 2.030 |
| 2002 | 287 804 000 | 4 021 726 | 2 443 387 | 1 578 339 | 14.0 | 8.5 | 5.5 | 2.020 |
| 2003 | 290 326 000 | 4 089 950 | 2 448 288 | 1 641 662 | 14.1 | 8.4 | 5.6 | 2.047 |
| 2004 | 293 046 000 | 4 112 052 | 2 397 615 | 1 714 437 | 14.0 | 8.2 | 5.9 | 2.051 |
| 2005 | 295 753 000 | 4 138 349 | 2 448 017 | 1 690 332 | 14.0 | 8.3 | 5.7 | 2.057 |
| 2006 | 298 593 000 | 4 265 555 | 2 426 264 | 1 839 291 | 14.3 | 8.1 | 6.2 | 2.108 |
| 2007 | 301 580 000 | 4 316 234 | 2 423 712 | 1 892 522 | 14.3 | 8.0 | 6.3 | 2.120 |
| 2008 | 304 375 000 | 4 247 694 | 2 471 984 | 1 775 710 | 14.0 | 8.1 | 5.9 | 2.072 |
| 2009 | 307 007 000 | 4 130 665 | 2 437 163 | 1 693 502 | 13.5 | 7.9 | 5.6 | 2.002 |
| 2010 | 309 330 000 | 3 999 386 | 2 468 435 | 1 530 951 | 13.0 | 8.0 | 5.0 | 1.931 |
| 2011 | 311 583 000 | 3 953 590 | 2 515 458 | 1 438 412 | 12.7 | 8.1 | 4.6 | 1.894 |
| 2012 | 313 874 000 | 3 952 841 | 2 543 279 | 1 409 562 | 12.6 | 8.1 | 4.5 | 1.880 |
| 2013 | 316 129 000 | 3 932 181 | 2 596 993 | 1 336 183 | 12.4 | 8.2 | 4.2 | 1.857 |
| 2014 | 319 113 000 | 3 988 076 | 2 626 418 | 1 361 658 | 12.5 | 8.2 | 4.3 | 1.862 |
| 2015 | 321 442 000 | 3 978 497 | 2 712 630 | 1 265 867 | 12.4 | 8.4 | 4.0 | 1.843 |
| 2016 | 323 100 000 | 3 945 875 | 2 744 248 | 1 201 627 | 12.2 | 8.5 | 3.7 | 1.820 |
| 2017 [68] [69] | 325 719 000 | 3 855 500 | 2 813 503 | 1 041 997 | 11.8 | 8.7 | 3.1 | 1.765 |
| 2018 [70] [71] | 326 687 000 | 3 791 712 | 2 839 205 | 952 507 | 11.6 | 8.7 | 2.9 | 1.729 |
| 2019 | 328 240 000 | 3 747 540 | 2 854 858 | 892 682 | 11.4 | 8.7 | 2.7 | 1.706 |
| 2020 [72] [73] | 331 449 281 | 3 613 647 | 3 383 729 | 229 918 | 10.9 | 10.2 | 0,7 | 1.641 |
| 2021 [74] [1] [75] | 331 893 745 | 3 658 162 | 3 466 804 | 191 358 | 11.0 | 10.4 | 0,6 |
Statistiques vitales actuelles
[76]
| Période | Naissances vivantes | Décès | Augmentation naturelle |
|---|---|---|---|
| Janvier – Décembre 2020 | 3 611 000 | 3 382 000 | +229 000 |
| Janvier – Décembre 2021 | 3 658 000 | 3 459 000 | +199 000 |
| Différence | |
|
|
Tableau de la population projetée aux États-Unis, 2017-2060
Les projections de 2017 du United States Census Bureau ont été produites à l’aide de la méthode des composantes par cohorte. Dans la méthode des composantes par cohorte, les composantes de l’évolution de la population (fécondité, mortalité et migration nette) sont projetées séparément pour chaque cohorte de naissance (personnes nées une année donnée). La population de base est augmentée chaque année en utilisant les taux de survie projetés et la migration internationale nette. Chaque année, une nouvelle cohorte de naissance est ajoutée à la population en appliquant les taux de fécondité projetés à la population féminine.
| An | Population |
|---|---|
| 2017 | 325 511 |
| 2018 | 327 892 |
| 2019 | 330 269 |
| 2020 | 332 639 |
| 2021 | 334 998 |
| 2022 | 337 342 |
| 2023 | 339 665 |
| 2024 | 341 963 |
| 2025 | 344 234 |
| 2026 | 346 481 |
| 2027 | 348 695 |
| 2028 | 350 872 |
| 2029 | 353 008 |
| 2030 | 355 101 |
| 2031 | 357 147 |
| 2032 | 359 147 |
| 2033 | 361 099 |
| 2034 | 363 003 |
| 2035 | 364 862 |
| 2036 | 366 676 |
| 2037 | 368 448 |
| 2038 | 370 179 |
| 2039 | 371 871 |
| 2040 | 373 528 |
| 2041 | 375 152 |
| 2042 | 376 746 |
| 2043 | 378 314 |
| 2044 | 379 861 |
| 2045 | 381 390 |
| 2046 | 382 907 |
| 2047 | 384 415 |
| 2048 | 385 918 |
| 2049 | 387 419 |
| 2050 | 388 922 |
| 2051 | 390 431 |
| 2052 | 391 947 |
| 2053 | 393 473 |
| 2054 | 395 009 |
| 2055 | 396 557 |
| 2056 | 398 118 |
| 2057 | 399 691 |
| 2058 | 401 277 |
| 2059 | 402 874 |
| 2060 | 404 483 |
Depuis 2011
Le US Census Bureau a une horloge de la population américaine et mondiale avec une fonction “Sélectionner une date”. [12] “Bureau du recensement des États-Unis, Horloge de la population des États-Unis et du monde, AKA popclock” .
| An | Population |
|---|---|
| 2011 | 311 583 481 |
| 2012 | 313 877 662 |
| 2013 | 316 059 947 |
| 2014 | 318 386 329 |
| 2015 | 320 738 994 |
| 2016 | 323 071 755 |
| 2017 | 325 122 128 |
| 2018 | 326 838 199 |
| 2019 | 328 329 953 |
| 2020 | 331 501 080 |
| 2021 | 331 893 745 |
Depuis 1790
| Apprendre encore plus Cette rubrique doit être mise à jour . La raison invoquée est : Mettre à jour une fois l’estimation 2021 disponible. ( avril 2021 ) Please help update this article to reflect recent events or newly available information. | ||
| Population historique | ||
|---|---|---|
| Recensement | Populaire. | %± |
| 1790 | 3 929 214 | — |
| 1800 | 5 236 631 | 33,3 % |
| 1810 | 7 239 881 | 38,3 % |
| 1820 | 9 638 453 | 33,1 % |
| 1830 | 12 866 020 | 33,5 % |
| 1840 | 17 069 453 | 32,7 % |
| 1850 | 23 191 876 | 35,9 % |
| 1860 | 31 443 321 | 35,6 % |
| 1870 | 38 558 371 | 22,6 % |
| 1880 | 49 371 340 | 28,0 % |
| 1890 | 62 979 766 | 27,6 % |
| 1900 | 76 212 168 | 21,0 % |
| 1910 | 92 228 531 | 21,0 % |
| 1920 | 106 021 568 | 15,0 % |
| 1930 | 123 202 660 | 16,2 % |
| 1940 | 132 165 129 | 7,3 % |
| 1950 | 151 325 798 | 14,5 % |
| 1960 | 179 323 175 | 18,5 % |
| 1970 | 203 211 926 | 13,3 % |
| 1980 | 226 545 805 | 11,5 % |
| 1990 | 248 709 873 | 9,8 % |
| 2000 | 281 421 906 | 13,2 % |
| 2010 | 308 745 538 | 9,7 % |
| 2020 | 331 449 281 | 7,4 % |
| Sources : Bureau du recensement des États-Unis [78] [79] [80] [81] Données de 2020 (selon l’horloge démographique) [12] Notez que les chiffres du recensement n’incluent pas les natifs américains avant 1860. |
En 1900, alors que la population américaine était de 76 millions, il y avait 66,8 millions de Blancs américains aux États-Unis, soit 88 % de la population totale, [82] 8,8 millions de Noirs américains, dont environ 90 % vivaient encore dans les États du Sud, [83] et un peu plus de 500 000 Hispaniques. [84]
En vertu de la loi, l’Immigration and Nationality Act de 1965 [85] , le nombre d’immigrants de première génération vivant aux États-Unis a augmenté [86] , passant de 9,6 millions en 1970 à environ 38 millions en 2007 [87]. millions de personnes ont immigré légalement aux États-Unis par an dans les années 1990, contre 250 000 par an dans les années 1950. [88]
En 1900, les Blancs non hispaniques représentaient près de 97 % de la population des 10 plus grandes villes américaines . [89] Le Census Bureau a rapporté que les minorités (y compris les Blancs hispaniques) représentaient 50,4 % des enfants nés aux États-Unis entre juillet 2010 et juillet 2011, [90] contre 37 % en 1990. [91]
En 2014, l’État avec le taux de fécondité le plus bas était le Rhode Island, avec un taux de 1,56, tandis que l’Utah avait le taux le plus élevé avec un taux de 2,33. [49] Cela est en corrélation avec l’âge des populations des États : Rhode Island a le neuvième âge médian le plus ancien aux États-Unis – 39,2 – tandis que l’Utah a le plus jeune – 29,0. [92]
En 2017, le taux de natalité aux États-Unis reste bien en deçà du niveau de remplacement nécessaire – au moins 2,1 enfants par femme pour ne pas subir de diminution de la population – car les naissances américaines blanches ont chuté dans les 50 États et le district de Columbia. Parmi les femmes blanches non hispaniques, aucun État n’avait un taux de fécondité supérieur au seuil de remplacement. Parmi les femmes noires non hispaniques, 12 États ont dépassé le niveau de remplacement nécessaire. Parmi les femmes hispaniques, 29 États l’ont fait. [93]Pour les femmes blanches non hispaniques, le taux de fécondité total le plus élevé était dans l’Utah, à 2,099, et le plus bas dans le district de Columbia, à 1,012. Parmi les femmes noires non hispaniques, le taux de fécondité total le plus élevé était dans le Maine, à 4,003, et le plus bas dans le Wyoming, à 1,146. Pour les femmes hispaniques, le taux de fécondité total le plus élevé était en Alabama, à 3,085, et le plus bas dans le Vermont, à 1,200, et dans le Maine, à 1,281. [93] [94] En raison du vieillissement et des faibles taux de natalité chez les Blancs, les décès sont maintenant plus nombreux que les naissances chez les Blancs (non hispaniques) dans plus de la moitié des États du pays. [95]
En 2018, les naissances aux États-Unis sont tombées au niveau le plus bas en 32 ans. [96]
Âge médian de la population
Âge médian de la population américaine à travers l’histoire. Source : Département du commerce des États-Unis . Bureau of Census , United States Census Bureau et The World Factbook . [67] [97]
| Années | 1820 | 1830 | 1840 | 1850 | 1860 | 1870 | 1880 | 1890 | 1900 | |||
|---|---|---|---|---|---|---|---|---|---|---|---|---|
| Âge médian de la population totale | 16.7 | 17.2 | 17.8 | 18.9 | 19.4 | 20.2 | 20.9 | 22,0 | 22,9 | |||
| Âge médian des hommes | 16.6 | 17.2 | 17.9 | 19.2 | 19.8 | 20.2 | 21.2 | 22.3 | 23.3 | |||
| Âge médian des femmes | 16.8 | 17.3 | 17.8 | 18.6 | 19.1 | 20.1 | 20.7 | 21.6 | 22.4 | |||
| Années | 1910 | 1920 | 1930 | 1940 | 1950 | 1960 | 1970 | 1980 | 1990 | 2000 | 2010 | 2018 |
| Âge médian de la population totale | 24.1 | 25.3 | 26,5 | 29,0 | 30.2 | 29.6 | 28.1 | 30,0 | 32,9 | 35.3 | 37.2 | 38.2 |
| Âge médian des hommes | 24.6 | 25,8 | 26,7 | 29.1 | 29,9 | 28,7 | 26,8 | 28,8 | 31,7 | 34,0 | 35,8 | 36,9 |
| Âge médian des femmes | 23,5 | 24,7 | 25.2 | 29,0 | 30,5 | 30.4 | 29.8 | 31.2 | 34.1 | 36,5 | 38,5 | 39,5 |
Statistiques de l’état civil
 États des États-Unis indiqués avec changement de population Recensement de 2010 à 2020 [98] -2,00 % ou moins -0,01% à -1,99% 0% à 0,99% 1 % à 2,49 % 2,5 % à 4,99 % 5% à 8,99% 9% à 11,99% 12% ou plus
Le taux de fécondité total des États-Unis en 2020 est de 1,641 [34]
- 1,86 pour les Américains blancs (y compris les Hispaniques blancs )
- 1,55 pour les blancs non hispaniques [34]
- 1,71 pour les Noirs non hispaniques [34]
- 1,65 pour les Amérindiens (y compris les Hispaniques)
- 1,53 pour les Américains d’origine asiatique (y compris les Hispaniques)
Autre : [49]
- 1,88 pour les Hispaniques (de tous les groupes raciaux) [34]
( Notez que ≈95 % des Hispaniques sont inclus dans la catégorie des “Hispaniques blancs” par le CDC, qui ne reconnaît pas la catégorie “Une autre race” du recensement et compte les personnes de cette catégorie comme blanches.)
Source : Rapport national sur les statistiques de l’état civil basé sur les données du recensement américain de 2010 [26]
Taux de fécondité totale de 1800 à 2010
L’ indice synthétique de fécondité est le nombre d’enfants nés par femme. Sources : Ansley J. Coale , Zelnik et Centre national des statistiques sur la santé . [99]
| Années | 1800 | 1810 | 1820 | 1830 | 1840 | 1850 | 1860 | 1870 | 1880 | 1890 | 1900 [99] |
|---|---|---|---|---|---|---|---|---|---|---|---|
| Taux de fécondité total aux États-Unis | 7.0 | 6.9 | 6.7 | 6.6 | 6.1 | 5.4 | 5.2 | 4.6 | 4.2 | 3.9 | 3.6 |
| Années | 1910 | 1920 | 1930 | 1940 | 1950 | 1960 | 1970 | 1980 | 1990 | 2000 | 2010 [99] |
| Taux de fécondité total aux États-Unis | 3.4 | 3.2 | 2.5 | 2.2 | 3.0 | 3.5 | 2.5 | 1.8 | 2.08 | 2.06 | 1,93 |
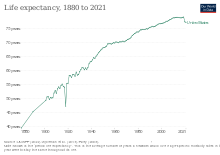
Espérance de vie à la naissance de 1901 à 2015
Espérance de vie aux États-Unis de 1901 à 2015. Source : Our World In Data et les Nations Unies .
1901–1950
| Années | 1901 | 1902 | 1903 | 1904 | 1905 | 1906 | 1907 | 1908 | 1909 | 1910 [100] |
|---|---|---|---|---|---|---|---|---|---|---|
| L’espérance de vie aux États-Unis | 49.3 | 50,5 | 50,6 | 49,6 | 50.3 | 50.2 | 50.1 | 51,9 | 52,8 | 51,8 |
| Années | 1911 | 1912 | 1913 | 1914 | 1915 | 1916 | 1917 | 1918 | 1919 | 1920 [100] |
| L’espérance de vie aux États-Unis | 53,4 | 54.1 | 53,5 | 54,6 | 55.1 | 54.2 | 54,0 | 47,0 | 55.3 | 55,4 |
| Années | 1921 | 1922 | 1923 | 1924 | 1925 | 1926 | 1927 | 1928 | 1929 | 1930 [100] |
| L’espérance de vie aux États-Unis | 58.2 | 58.1 | 57,5 | 58,5 | 58,5 | 57,9 | 59,4 | 58.3 | 58,5 | 59,6 |
| Années | 1931 | 1932 | 1933 | 1934 | 1935 | 1936 | 1937 | 1938 | 1939 | 1940 [100] |
| L’espérance de vie aux États-Unis | 60.3 | 61,0 | 60,9 | 60.2 | 60,9 | 60.4 | 61.1 | 62.4 | 63.1 | 63.2 |
| Années | 1941 | 1942 | 1943 | 1944 | 1945 | 1946 | 1947 | 1948 | 1949 | 1950 [100] |
| L’espérance de vie aux États-Unis | 63,8 | 64,6 | 64.3 | 65.1 | 65,6 | 66,3 | 66,7 | 67,3 | 67,6 | 68.1 |
1901–2015
| Période | Espérance de vie en années |
|---|---|
| 1901-1909 | 49,3 – 52,8 |
| 1910-1919 | 53,5 – 55,3 [101] |
| 1920-1929 | 55,4 – 59,4 |
| 1930-1939 | 60.2 – 63.1 |
| 1940-1949 | 63,8 – 67,6 |
| 1950–1955 | 68,7 |
| 1955-1960 | 69,7 |
| 1960-1965 | 70.1 |
| 1965-1970 | 70.4 |
| 1970-1975 | 71.4 |
| 1975-1980 | 73,3 |
| 1980–1985 | 74,4 |
| 1985–1990 | 74,9 |
| 1990–1995 | 75,7 |
| 1995–2000 | 76,5 |
| 2000–2005 | 77.2 |
| 2005–2010 | 78.2 |
| 2010-2015 | 78,9 |
| 2015–2020 | 78,8 |
Source : Perspectives de la population mondiale des Nations Unies [102]
Répartition en pourcentage de la population totale par âge : 1900 à 2015 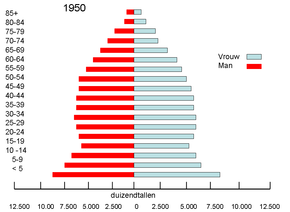 Pyramide des âges des États-Unis en 1950
Sources : US Census Bureau, US Department of Commerce, projections de la variante moyenne des Nations Unies. [103] [104]
| Âge | 1900 | 1910 | 1920 | 1930 | 1940 | 1950 | 1960 | 1970 | 1980 | 1990 | 2000 | 2010 | 2015 |
|---|---|---|---|---|---|---|---|---|---|---|---|---|---|
| 0–14 ans | 34,5 | 32.1 | 31,8 | 29.4 | 25,0 | 26,9 | 31.1 | 28,5 | 22.6 | 21,5 | 21.4 | 20.2 | 19.8 |
| 15–24 ans | 19.6 | 19.7 | 17.7 | 18.3 | 18.2 | 14.7 | 13.4 | 17.4 | 18.8 | 14.8 | 13.9 | ||
| 25–44 ans | 28.1 | 29.2 | 29.6 | 29,5 | 30.1 | 30,0 | 26.2 | 23.6 | 27,7 | 32,5 | 30.2 | ||
| 45–64 ans | 13.7 | 14.6 | 16.1 | 17.5 | 19.8 | 20.3 | 20.1 | 20.6 | 19.6 | 18.6 | 22,0 | ||
| 65 ans et plus | 4.1 | 4.3 | 4.7 | 5.4 | 6.8 | 8.1 | 9.2 | 9.9 | 11.3 | 12.6 | 12.4 | 13.0 | 14.3 |
| Total (%) | 100 | 100 | 100 | 100 | 100 | 100 | 100 | 100 | 100 | 100 | 100 | 33.2 | 34.1 |
Centres de population
Les États-Unis comptent des dizaines de grandes villes, dont 31 « villes mondiales » [105] de tous types, dont 10 dans le groupe « alpha » des villes mondiales : New York , Los Angeles , Chicago , Washington, DC , Boston , San Francisco . , Miami , Philadelphie , Dallas et Atlanta . [106] En 2011 [update], les États-Unis comptaient 51 zones métropolitaines avec une population de plus de 1 000 000 d’habitants chacune. (Voir le tableau des zones statistiques métropolitaines des États-Unis .)
En 2011 [update], environ 250 millions d’Américains vivaient dans ou autour des zones urbaines. Cela signifie que plus des trois quarts de la population américaine se partagent environ trois pour cent de la superficie des États-Unis. [107]
Le tableau suivant montre les populations des vingt principales régions métropolitaines. Remarque Denver et Baltimore comptent plus de 2,5 millions d’habitants dans leurs zones métropolitaines, et la zone métropolitaine de San Juan (Puerto Rico) compte plus de 2 millions d’habitants. [108]
| Principaux centres de population ( voir la liste complète ) |
|
||||
|---|---|---|---|---|---|
| Rang | Centre-ville (villes) | Population de la région métropolitaine | Zone statistique métropolitaine | Région [109] |  New York  Los Angeles  Chicago  Dallas |
| 1 | New York | 19 979 477 | New York–Newark–Jersey City, NY–NJ–PA MSA | Nord-est | |
| 2 | Los Angeles | 13 291 486 | Los Angeles–Long Beach–Anaheim, Californie MSA | Ouest | |
| 3 | Chicago | 9 498 716 | Chicago–Joliet–Naperville, IL–IN–WI MSA | Midwest | |
| 4 | Dallas–Fort Worth | 7 539 711 | Dallas–Fort Worth–Arlington, TX MSA | Sud | |
| 5 | Houston | 6 997 384 | Houston–The Woodlands-Sugar Land MSA | Sud | |
| 6 | Washington DC | 6 249 950 | Washington, DC–VA–MD–WV MSA | Sud | |
| 7 | Miami | 6 198 782 | Miami–Fort Lauderdale–West Palm Beach, Floride MSA | Sud | |
| 8 | crême Philadelphia | 6 096 372 | Philadelphie–Camden–Wilmington, PA–NJ–DE–MD MSA | Nord-est | |
| 9 | Atlanta | 5 949 951 | Atlanta–Sandy Springs–Roswell, Géorgie MSA | Sud | |
| dix | Boston | 4 875 390 | Boston–Cambridge–Quincy, MA–NH MSA | Nord-est | |
| 11 | Phénix | 4 857 962 | Phoenix–Mesa–Chandler, AZ MSA | Ouest | |
| 12 | San Fransisco | 4 729 484 | San Francisco–Oakland–Berkeley, Californie MSA | Ouest | |
| 13 | Riverside–San Bernardino | 4 662 361 | Riverside–San Bernardino–Ontario, CA MSA | Ouest | |
| 14 | Détroit | 4 326 442 | Détroit–Warren–Dearborn, MI MSA | Midwest | |
| 15 | Seattle | 3 939 363 | Seattle–Tacoma–Bellevue, WA MSA | Ouest | |
| 16 | Minneapolis–St. Paul | 3 629 190 | Minneapolis–St. Paul–Bloomington, MN–WI MSA | Midwest | |
| 17 | San Diego | 3 343 364 | San Diego–Carlsbad–San Marcos, Californie MSA | Ouest | |
| 18 | Tampa–St. Pétersbourg | 3 142 663 | Tampa–St. Petersburg–Clearwater, Floride MSA | Sud | |
| 19 | Denver | 2 932 415 | Denver–Aurora–Lakewood, CO MSA | Ouest | |
| 20 | Saint Louis | 2 805 465 | St. Louis, MO-IL MSA | Midwest | |
| Basé sur les estimations de la population MSA de 2018 du US Census Bureau |
Race et ethnie
Groupes raciaux et ethniques aux États-Unis (recensement de 2020) [110]
Américains blancs non latinos (57,8%) Latino-Américains (de toute race) (18,7%) Noirs américains (12,1%) Américains d’origine asiatique (5,9%) Deux courses ou plus (4,1 %) Amérindiens (0,7%) Une autre race (0,5%) Américains insulaires du Pacifique (0,2%)
Groupes raciaux aux États-Unis (recensement de 2020), y compris l’identification raciale des Latinos [111]
Américains blancs (61,6%) Noirs américains (12,4%) Deux courses ou plus (10,2 %) Une autre race (8,4%) Américains d’origine asiatique (6,0%) Amérindiens (1,1%) Américains insulaires du Pacifique (0,2%)  Comtés aux États-Unis par population non blanche (c’est-à-dire à l’exclusion des Blancs non hispaniques ) selon les estimations sur 5 ans de l’Enquête sur la communauté américaine du US Census Bureau 2013–2017. [27] Les comtés avec des populations non blanches plus importantes que les États-Unis dans leur ensemble sont entièrement violets.
  États des États-Unis par population non blanche selon l’enquête sur la communauté américaine du US Census Bureau 2013–2017 5-Year Estimates. [27] Les États avec des populations non blanches plus importantes que les États-Unis dans leur ensemble sont entièrement violets.
Course
 Pyramide des âges par race
Le Bureau du recensement des États-Unis recueille des données raciales conformément aux directives fournies par le Bureau américain de la gestion et du budget (OMB), et ces données sont basées sur l’auto-identification. De nombreux autres pays comptent plusieurs races en fonction de leur origine, tandis que l’Amérique compile plusieurs dizaines de groupes ethniques en couleur de peau en les regroupant. Les classifications et définitions raciales utilisées par le US Census Bureau sont : [112]
- Blanc : une personne ayant des origines dans l’un des peuples originaires d’Europe, du Moyen-Orient ou d’Afrique du Nord. [113] Cela inclut les personnes qui indiquent leur race comme “Blanche” ou signalent des entrées telles que Afghan, Iranien, Irlandais, Allemand, Italien, Libanais, Arabe, Marocain ou Caucasien.
- Noir ou Afro-américain : une personne ayant des origines dans l’un des groupes raciaux noirs d’Afrique. [113] Cela inclut les personnes qui indiquent leur race comme “Noir, Africain Am.” ou signaler des entrées telles que afro-américain, kenyan, nigérian ou haïtien.
- Amérindien ou natif de l’Alaska : une personne ayant des origines dans l’un des peuples originaux d’Amérique du Nord et du Sud (y compris l’Amérique centrale) et qui maintient une affiliation tribale ou un attachement communautaire. [113] Cette catégorie comprend les personnes qui indiquent leur race comme “Indien d’Amérique ou natif de l’Alaska” ou signalent des entrées telles que Navajo, Blackfeet, Inupiat, Yup’ik, des groupes d’Indiens d’Amérique centrale ou des groupes d’Indiens d’Amérique du Sud.
- Asiatique : une personne ayant des origines dans l’un des peuples originaires de l’Extrême-Orient, de l’Asie du Sud-Est ou du sous-continent indien, y compris, par exemple : le Bangladesh, le Cambodge, la Chine, l’Inde, le Japon, la Corée, la Malaisie, le Pakistan, les îles Philippines, Taïwan , la Thaïlande et le Vietnam. [113]
- Natif d’Hawaï ou d’un autre insulaire du Pacifique : une personne ayant des origines dans l’un des peuples d’origine d’Hawaï, de Guam, des Samoa ou d’autres îles du Pacifique. [113]
- Une autre race : inclut toutes les autres réponses non incluses dans les catégories raciales « Blanc », « Noir ou Afro-américain », « Indien américain ou natif de l’Alaska », « Asiatique » et « Hawaïen natif ou autre insulaire du Pacifique » décrites ci-dessus comprend les Asiatiques d’Asie occidentale ou de Russie (Russie non européenne) et d’Africains blancs
- Deux races ou plus : les utilisateurs peuvent choisir de proposer deux races ou plus en cochant deux ou plusieurs cases à cocher de réponse raciale, en fournissant plusieurs réponses ou une combinaison de cases à cocher et d’autres réponses.
Les données sur la race et l’ethnicité sont autodéclarées au Bureau du recensement. Depuis le recensement de 2000, le Congrès a autorisé les gens à s’identifier selon plus d’une classification raciale en sélectionnant plus d’une catégorie . Cependant, une seule ethnie peut être sélectionnée, car le recensement américain ne reconnaît que deux ethnies – hispanique et non hispanique – qui s’excluent mutuellement puisque vous pouvez être l’une ou l’autre, mais pas les deux. Le Census Bureau définit “Hispanique” comme toute personne ayant un lien ancestral avec l’Amérique latine.
Selon l’ American Community Survey 2013-2017 , la composition raciale des États-Unis en 2017 était : [114]
| Course | Population (estimation 2017) | Part de la population totale |
|---|---|---|
| Total | 321 004 407 | 100% |
| Une course | 310 923 363 | 96,9 % |
| Blanc | 234 370 202 | 73,0 % |
| Noir ou afro-américain | 40 610 815 | 12,7 % |
| Amérindien et natif de l’Alaska | 2 632 102 | 0,8 % |
| asiatique | 17 186 320 | 5,4 % |
| Hawaïen natif et autre insulaire du Pacifique | 570 116 | 0,2 % |
| Autres courses | 15 553 808 | 4,8 % |
| Deux courses ou plus | 10 081 044 | 3,1 % |
| Blanc et noir ou afro-américain | 2 657 560 | 0,8 % |
| Indien blanc et américain et natif de l’Alaska | 1 905 946 | 0,6 % |
| Blanc et asiatique | 2 057 321 | 0,6 % |
| Noir ou afro-américain et amérindien et natif de l’Alaska | 319 097 | 0,1 % |
| Hispanique ou Latino (de toute race) | 56 510 571 | 17,6 % |
| mexicain | 35 709 528 | 11,1 % |
| portoricain | 5 418 521 | 1,7 % |
| cubain | 2 158 962 | 0,7 % |
| Autre hispanique ou latino | 13 223 560 | 4,1 % |
| Pas Hispanique ou Latino | 264 493 836 | 82,4 % |
| Blanc (non hispanique) | 197 277 789 | 61,5 % |
| Noir ou afro-américain (non hispanique) | 39 445 495 | 12,3 % |
| Amérindien et natif de l’Alaska (non hispanique) | 2 098 763 | 0,7 % |
| Asiatique (non hispanique) | 16 989 540 | 5,3 % |
| Hawaïen natif et autre insulaire du Pacifique (non hispanique) | 515 522 | 0,2 % |
| Une autre race (non hispanique) | 715 432 | 0,2 % |
| Deux courses ou plus | 7 451 295 | 2,3 % |
Répartition de la population totale par race, 1900 à 2020 (en %)
Les hispaniques sont montrés comme faisant partie des races. Source : Bureau du recensement des États-Unis . [103] [97]
| Années | 1900 | 1910 | 1920 | 1930 | 1940 | 1950 | 1960 | 1970 | 1980 | 1990 | 2000* | 2010* | 2020* |
|---|---|---|---|---|---|---|---|---|---|---|---|---|---|
| Blanc | 87,9 | 88,9 | 89,7 | 89,8 | 89,8 | 89,5 | 88,6 | 87,5 | 83,0 | 80.3 | 75.1 | 72,4 | 61,6 |
| Noir ou afro-américain | 11.6 | 10.7 | 9.9 | 9.7 | 9.8 | 10.0 | 10.5 | 11.1 | 11.7 | 12.1 | 12.3 | 12.6 | 12.4 |
| Amérindien et natif de l’Alaska | 0,8 | 0,8 | 0,9 | 0,9 | 1.1 | ||||||||
| Hawaïen asiatique et autochtone et autre insulaire du Pacifique |
1.5 | 2.9 | 3.8 | 5.0 | 6.2 | ||||||||
| Une autre race | 3.0 | 3.9 | 5.5 | 6.2 | 8.4 | ||||||||
| Deux courses ou plus | 2.4 | 2.9 | 10.2 | ||||||||||
| Somme (%) | 99,5 | 99,6 | 99,6 | 99,5 | 99,6 | 99,5 | 99,1 | 98,6 | 100 | 100 | 100 | 100 | 100 |
* Les données sont présentées pour les populations blanches, noires ou afro-américaines, amérindiennes et autochtones de l’Alaska, asiatiques et autochtones hawaïennes et autres insulaires du Pacifique, et certaines autres races seules.
Âge médian de chaque race, 2010 (non hispanique)
Source : Bureau du recensement des États-Unis. [115]
| Course | Âge médian (les deux sexes) (années) | Âge médian (hommes) (années) | Âge médian (femme) (années) |
|---|---|---|---|
| Total (non hispanique) | 39,6 | 38,4 | 40,8 |
| Blanc | 42,0 | 40,7 | 43.3 |
| Noir ou afro-américain | 32,7 | 30,9 | 34.3 |
| Amérindien et natif de l’Alaska | 31,7 | 30.6 | 32,7 |
| asiatique | 35.4 | 34.3 | 36,4 |
| Hawaïen natif et autre insulaire du Pacifique | 29,7 | 29.2 | 30.2 |
| Deux courses ou plus | 19.0 | 18.1 | 19.8 |
Âge médian de chaque race, 2017 (non hispanique)
Source : Bureau du recensement des États-Unis. [115]
| Course | Âge médian (les deux sexes) (années) | Âge médian (hommes) (années) | Âge médian (femme) (années) | |||||||||||||||
|---|---|---|---|---|---|---|---|---|---|---|---|---|---|---|---|---|---|---|
| Total (non hispanique) | 40,5 | 39.1 | 42,0 | |||||||||||||||
| Blanc | 43,5 | 42.1 | 45,0 | |||||||||||||||
| Noir ou afro-américain | 34.2 | 32.3 | 36,0 | |||||||||||||||
| Amérindien et natif de l’Alaska | 33,6 | 32.4 | 34,8 | |||||||||||||||
| asiatique | 36,9 | 35,5 | 38.1 | |||||||||||||||
| Hawaïen natif et autre insulaire du Pacifique | 32,9 | 32.4 | 33.4 | |||||||||||||||
| Deux courses ou plus | 20.3 | 19.5 | 21.2 | |||||||||||||||
| Race/ethnie | Blanc | Noir ou afro-américain |
hispanique | asiatique | Amérindien et natif de l’Alaska |
Hawaïen et insulaire du Pacifique |
Multiracial | |||||||||||
| Âge le plus courant | 58 ans | 27 ans | 11 ans | 29 ans | 26 ans | 28 ans | 3 ans | |||||||||||
| État ou territoire | Population (estimation 2015) |
Blanc | Noir ou afro-américain |
Amérindien et natif de l’Alaska |
asiatique | Hawaïen natif et autre insulaire du Pacifique |
Une autre race | Deux courses ou plus | ||||||||||
| Alabama | 4 830 620 | 68,8 % | 26,4 % | 0,5 % | 1,2 % | 0,1 % | 1,3 % | 1,7 % | ||||||||||
| Alaska | 733 375 | 66,0 % | 3,4 % | 13,8 % | 5,9 % | 1,2 % | 1,3 % | 8,4 % | ||||||||||
| Arizona | 6 641 928 | 78,4 % | 4,2 % | 4,4 % | 3,0 % | 0,2 % | 6,5 % | 3,2 % | ||||||||||
| Arkansas | 2 958 208 | 78,0 % | 15,5 % | 0,6 % | 1,4 % | 0,2 % | 2,1 % | 2,1 % | ||||||||||
| Californie | 38 421 464 | 61,8 % | 5,9 % | 0,7 % | 13,7 % | 0,4 % | 12,9 % | 4,5 % | ||||||||||
| Colorado | 5 278 906 | 84,2 % | 4,0 % | 0,9 % | 2,9 % | 0,1 % | 4,3 % | 3,5 % | ||||||||||
| Connecticut | 3 593 222 | 77,3 % | 10,3 % | 0,2 % | 4,2 % | 0,0 % | 5,1 % | 2,8 % | ||||||||||
| Delaware | 926 454 | 69,4 % | 21,6 % | 0,3 % | 3,6 % | 0,0 % | 2,3 % | 2,7 % | ||||||||||
| District de Colombie | 647 484 | 40,2 % | 48,9 % | 0,3 % | 3,7 % | 0,0 % | 4,2 % | 2,7 % | ||||||||||
| Floride | 19 645 772 | 76,0 % | 16,1 % | 0,3 % | 2,6 % | 0,1 % | 2,5 % | 2,4 % | ||||||||||
| Géorgie | 10 006 693 | 60,2 % | 30,9 % | 0,3 % | 3,6 % | 0,0 % | 2,8 % | 2,1 % | ||||||||||
| Hawaii | 1 406 299 | 25,4 % | 2,0 % | 0,2 % | 37,7 % | 9,9 % | 1,1 % | 23,7 % | ||||||||||
| Idaho | 1 616 547 | 91,7 % | 0,6 % | 1,3 % | 1,3 % | 0,1 % | 2,4 % | 2,6 % | ||||||||||
| Illinois | 12 873 761 | 72,3 % | 14,3 % | 0,2 % | 5,0 % | 0,0 % | 5,8 % | 2,2 % | ||||||||||
| Indiana | 6 568 645 | 84,2 % | 9,2 % | 0,2 % | 1,9 % | 0,0 % | 2,3 % | 2,2 % | ||||||||||
| Iowa | 3 093 526 | 91,2 % | 3,2 % | 0,3 % | 2,0 % | 0,1 % | 1,3 % | 2,0 % | ||||||||||
| Kansas | 2 892 987 | 85,2 % | 5,8 % | 0,8 % | 2,6 % | 0,1 % | 2,2 % | 3,3 % | ||||||||||
| Kentucky | 4 397 353 | 87,6 % | 7,9 % | 0,2 % | 1,3 % | 0,0 % | 0,9 % | 2,1 % | ||||||||||
| Louisiane | 4 625 253 | 62,8 % | 32,1 % | 0,6 % | 1,7 % | 0,0 % | 1,0 % | 1,8 % | ||||||||||
| Maine | 1 329 100 | 95,0 % | 1,1 % | 0,6 % | 1,1 % | 0,0 % | 0,2 % | 2,0 % | ||||||||||
| Maryland | 5 930 538 | 57,6 % | 29,5 % | 0,3 % | 6,0 % | 0,0 % | 3,6 % | 3,0 % | ||||||||||
| Massachusetts | 6 705 586 | 79,6 % | 7,1 % | 0,2 % | 6,0 % | 0,0 % | 4,2 % | 2,9 % | ||||||||||
| Michigan | 9 900 571 | 79,0 % | 14,0 % | 0,5 % | 2,7 % | 0,0 % | 1,1 % | 2,6 % | ||||||||||
| Minnesota | 5 419 171 | 84,8 % | 5,5 % | 1,0 % | 4,4 % | 0,0 % | 1,5 % | 2,7 % | ||||||||||
| Mississippi | 2 988 081 | 59,2 % | 37,4 % | 0,4 % | 1,0 % | 0,0 % | 0,9 % | 1,2 % | ||||||||||
| Missouri | 6 045 448 | 82,6 % | 11,5 % | 0,4 % | 1,8 % | 0,1 % | 1,1 % | 2,4 % | ||||||||||
| Montana | 1 014 699 | 89,2 % | 0,5 % | 6,5 % | 0,7 % | 0,1 % | 0,5 % | 2,5 % | ||||||||||
| Nebraska | 1 869 365 | 88,1 % | 4,7 % | 0,9 % | 2,0 % | 0,1 % | 1,9 % | 2,2 % | ||||||||||
| Nevada | 2 798 636 | 69,0 % | 8,4 % | 1,1 % | 7,7 % | 0,6 % | 8,8 % | 4,4 % | ||||||||||
| New Hampshire | 1 324 201 | 93,7 % | 1,3 % | 0,2 % | 2,4 % | 0,0 % | 0,5 % | 1,8 % | ||||||||||
| New Jersey | 8 904 413 | 68,3 % | 13,5 % | 0,2 % | 9,0 % | 0,0 % | 6,4 % | 2,5 % | ||||||||||
| Nouveau Mexique | 2 084 117 | 73,2 % | 2,1 % | 9,1 % | 1,4 % | 0,1 % | 10,9 % | 3,3 % | ||||||||||
| New York | 19 673 174 | 64,6 % | 15,6 % | 0,4 % | 8,0 % | 0,0 % | 8,6 % | 2,9 % | ||||||||||
| Caroline du Nord | 9 845 333 | 69,5 % | 21,5 % | 1,2 % | 2,5 % | 0,1 % | 3,0 % | 2,4 % | ||||||||||
| Dakota du nord | 721 640 | 88,7 % | 1,6 % | 5,3 % | 1,2 % | 0,0 % | 0,8 % | 2,2 % | ||||||||||
| Ohio | 11 575 977 | 82,4 % | 12,2 % | 0,2 % | 1,9 % | 0,0 % | 0,8 % | 2,5 % | ||||||||||
| Oklahoma | 3 849 733 | 73,1 % | 7,2 % | 7,3 % | 1,9 % | 0,1 % | 2,6 % | 7,8 % | ||||||||||
| Oregon | 3 939 233 | 85,1 % | 1,8 % | 1,2 % | 4,0 % | 0,4 % | 3,4 % | 4,1 % | ||||||||||
| Pennsylvanie | 12 779 559 | 81,6 % | 11,0 % | 0,2 % | 3,1 % | 0,0 % | 2,0 % | 2,1 % | ||||||||||
| Porto Rico | 3 583 073 | 69,7 % | 8,4 % | 0,3 % | 0,3 % | 0,0 % | 12,0 % | 9,3 % | ||||||||||
| Rhode Island | 1 053 661 | 81,1 % | 6,5 % | 0,5 % | 3,2 % | 0,0 % | 5,8 % | 2,8 % | ||||||||||
| Caroline du Sud | 4 777 576 | 67,2 % | 27,5 % | 0,3 % | 1,4 % | 0,1 % | 1,5 % | 2,0 % | ||||||||||
| Dakota du Sud | 843 190 | 85,0 % | 1,6 % | 8,6 % | 1,2 % | 0,0 % | 0,9 % | 2,6 % | ||||||||||
| Tennessee | 6 499 615 | 77,8 % | 16,8 % | 0,3 % | 1,6 % | 0,1 % | 1,5 % | 2,0 % | ||||||||||
| Texas | 26 538 614 | 74,9 % | 11,9 % | 0,5 % | 4,2 % | 0,1 % | 6,0 % | 2,5 % | ||||||||||
| Utah | 2 903 379 | 87,6 % | 1,1 % | 1,1 % | 2,2 % | 0,9 % | 4,5 % | 2,6 % | ||||||||||
| Vermont | 626 604 | 94,9 % | 1,1 % | 0,3 % | 1,4 % | 0,0 % | 0,3 % | 1,9 % | ||||||||||
| Virginie | 8 256 630 | 69,0 % | 19,2 % | 0,3 % | 6,0 % | 0,1 % | 2,2 % | 3,2 % | ||||||||||
| Washington | 6 985 464 | 77,8 % | 3,6 % | 1,3 % | 7,7 % | 0,6 % | 3,8 % | 5,2 % | ||||||||||
| Virginie-Occidentale | 1 851 420 | 93,6 % | 3,3 % | 0,2 % | 0,7 % | 0,0 % | 0,2 % | 2,0 % | ||||||||||
| Wisconsin | 5 742 117 | 86,5 % | 6,3 % | 0,9 % | 2,5 % | 0,0 % | 1,7 % | 2,1 % | ||||||||||
| Wyoming | 579 679 | 91,0 % | 1,1 % | 2,2 % | 0,9 % | 0,1 % | 2,1 % | 2,7 % | ||||||||||
| Territoire | Population (estimation 2010) |
Blanc | Noir ou afro-américain |
Amérindien et natif de l’Alaska |
asiatique | Hawaïen natif et autre insulaire du Pacifique |
Une autre race | Deux courses ou plus | ||||||||||
| Samoa américaines | 55 519 | 0,9 % | 0,0 % | — | 3,6 % | 92,6 % | 0,1 % | 2,7 % | ||||||||||
| Guam | 159 358 | 7,1 % | 1,0 % | — | 32,2 % | 49,3 % | 0,3 % | 9,4 % | ||||||||||
| Îles Mariannes du Nord | 53 883 | 2,1 % | 0,1 % | — | 49,9 % | 34,9 % | 0,2 % | 12,7 % | ||||||||||
| Îles Vierges américaines | 106 405 | 15,6 % | 76,0 % | — | 1,4 % | 0,0 % | 4,9 % | 2,1 % | ||||||||||
| An | Blanc seul | Noir seul | hispanique | Amérindien seul | asiatique seul | Insulaire du Pacifique seul | ||||||||||||
| 2018 | 51,6 % | 14,6 % | 23,4 % | 0,8 % | 6,4 % | 0,3 % | ||||||||||||
| An | Blanc | Noir ou afro-américain |
hispanique | asiatique | insulaire Pacifique | Indien d’Amérique natif de l’Alaska |
Deux courses ou plus | |||||||||||
| 2000 | 60% | 15% | 16% | 3% | — | 1% | 2% | |||||||||||
| 2017 | 51% | 14% | 25% | 5% | — | 1% | 4% | |||||||||||
| An | Blanc | Noir ou afro-américain |
hispanique | asiatique | insulaire Pacifique | Indien d’Amérique natif de l’Alaska |
Deux courses ou plus | |||||||||||
| 2000 | 62% | 14% | 18% | 4% | — | 1% | 1% | |||||||||||
| 2017 | 54% | 14% | 22% | 6% | — | 1% | 3% | |||||||||||
| Tranche d’âge | 85+ | 80–84 | 75–79 | 70–74 | 65–69 | 60–64 | 55–59 | 50–54 | 45–49 | 40–44 | 35–39 | 30–34 | 25–29 | 20–24 | 15–19 | 10–14 | 5–9 | <5 |
| blanc non hispanique | 83% | 81% | 79% | 78% | 77% | 74% | 72% | 69% | 65% | 61% | 58% | 57% | 57% | 56% | 55% | 54% | 52% | 50% |
| Minorité | 17% | 19% | 21% | 22% | 23% | 26% | 28% | 31% | 35% | 39% | 42% | 43% | 43% | 44% | 45% | 46% | 48% | 50% |
Origine hispanique ou latino
 CensusViewer US 2010 Census Latino Population sous forme de carte thermique par secteur de recensement.
L’Office of Management and Budget (OMB) des États-Unis définit « hispanique ou latino » comme une personne de culture ou d’origine cubaine, mexicaine, portoricaine, dominicaine, d’Amérique du Sud ou centrale ou d’une autre culture ou origine espagnole, quelle que soit sa race. Les personnes qui s’identifient aux termes « hispanique » ou « latino » sont celles qui se classent dans l’une des catégories spécifiques hispaniques ou latino-américaines figurant sur le questionnaire du recensement décennal et divers questionnaires d’enquête du Bureau du recensement – « mexicain, mexicain américain, chicano » ou “Portoricain” ou “Cubain” – ainsi que ceux qui indiquent qu’ils sont “d’une autre origine hispanique, latino ou espagnole”. [122] Les personnes qui identifient leur origine comme hispanique ou latino peuvent appartenir à n’importe quelle race. [112]
| Hispanique ou Latino et Race | Population (estimation 2015) | Pourcentage de la population totale |
|---|---|---|
| Population des États-Unis | 316 515 021 | 100% |
| Hispanique ou Latino (de toute race) | 54 232 205 | 17,1 % |
| Blanc | 35 684 777 | 11,3 % |
| Noir ou afro-américain | 1 122 369 | 0,3 % |
| Amérindien et natif de l’Alaska | 490 557 | 0,1 % |
| asiatique | 181 231 | 0,0 % |
| Hawaïen natif et autre insulaire du Pacifique | 46 724 | 0,0 % |
| Une autre race | 14 226 829 | 4,5 % |
| Deux courses ou plus | 2 479 718 | 0,8 % |
| Pas Hispanique ou Latino | 262 282 816 | 82,9 % |
Répartition de la population par origine hispanique 1970-2020 (en %)
Source : US Census Bureau , recensement décennal de la population, 1970 (échantillon de 5 %), 1980 à 2020. [97]
| Années | 1970 | 1980 | 1990 | 2000 | 2010 | 2020 |
|---|---|---|---|---|---|---|
| Pas Hispanique ou Latino | 95,5 | 93,6 | 91,0 | 87,5 | 83,7 | 81.3 |
| Hispanique ou Latino | 4.5 | 6.4 | 9.0 | 12.5 | 16.3 | 18.7 |
| Total (%) | 100 | 100 | 100 | 100 | 100 | 100 |
Âge médian de chaque race, 2010 (hispanique)
Source : Bureau du recensement des États-Unis. [115]
| Course | Âge médian (les deux sexes) (années) | Âge médian (hommes) (années) | Âge médian (femme) (années) |
|---|---|---|---|
| Total (hispanique) | 27.3 | 26,7 | 27,9 |
| Blanc | 27,8 | 27.2 | 28.4 |
| Noir ou afro-américain | 24,5 | 23,5 | 25.6 |
| Amérindien et natif de l’Alaska | 26,0 | 26.1 | 25,8 |
| asiatique | 25,0 | 24.4 | 25.6 |
| Hawaïen natif et autre insulaire du Pacifique | 24,9 | 24,8 | 24,9 |
| Deux courses ou plus | 19.6 | 19.1 | 20,0 |
Âge médian de chaque race, 2017 (hispanique)
Source : Bureau du recensement des États-Unis. [115]
| Course | Âge médian (les deux sexes) (années) | Âge médian (hommes) (années) | Âge médian (femme) (années) |
|---|---|---|---|
| Total (hispanique) | 29.3 | 28,8 | 29.8 |
| Blanc | 29.8 | 29.3 | 30.3 |
| Noir ou afro-américain | 26,8 | 25,8 | 27,9 |
| Amérindien et natif de l’Alaska | 28.6 | 29,0 | 28.1 |
| asiatique | 27.2 | 26,5 | 27,8 |
| Hawaïen natif et autre insulaire du Pacifique | 27,8 | 28.1 | 27.4 |
| Deux courses ou plus | 20.9 | 20.4 | 21.3 |
Remarque : l’origine hispanique est considérée comme une ethnie et non comme une race. Les hispaniques peuvent appartenir à n’importe quelle race.
Populations indigènes
En 2017, il y avait 2 098 763 Amérindiens et autochtones de l’ Alaska aux États-Unis, [114] représentant 0,7 % de la population américaine. Il y a 573 gouvernements tribaux reconnus au niveau fédéral [123] aux États-Unis. En 2000, les groupes les plus importants aux États-Unis en termes de population étaient Navajo , Cherokee , Choctaw , Sioux , Chippewa , Apache , Blackfeet , Iroquois et Pueblo .
Autres groupes
Il y avait 22,1 millions d’ anciens combattants en 2009 [124] , ce qui signifie que moins de 10 % des Américains ont servi dans les forces armées . [125]
En 2010, le Washington Post estimait qu’il y avait 11 millions d’immigrants sans papiers dans le pays. [126] En 2017, Pew Research a rapporté qu’il y avait environ 10,5 millions d’immigrants sans papiers aux États-Unis [127]
Il y avait environ 2 millions de personnes en prison en 2010. [128]
Projections
| 2015 | 2050 | |
|---|---|---|
| Américains blancs 1 | 77,4 % | 70,8 % |
| > Blancs non hispaniques | 61,8 % | 46,6 % |
| Noirs américains 1 | 13,2 % | 14,4 % |
| Américains d’origine asiatique 1 | 5,3 % | 7,7 % |
| Américains multiraciaux 1 | 2,6 % | 5,4 % |
| Hispaniques/Latinos (de toute race) | 17,8 % | 28,0 % |
| 1 Y compris les hispaniques |
Un rapport du US Census Bureau prévoit une diminution du ratio de Blancs entre 2010 et 2050, de 79,5% à 74,0%. [130] Dans le même temps, les Blancs non hispaniques ne devraient plus constituer la majorité de la population d’ici 2045, mais resteront le groupe ethnique le plus important. En 2050, ils composeront 46,3% de la population. Les Blancs non hispaniques représentaient 85% de la population en 1960. [131] Cependant, les Américains blancs dans leur ensemble devraient toujours représenter plus de 70% de la population en 2050.
Le rapport prévoit que la population hispanique ou latino-américaine passera de 16 % aujourd’hui à 30 % d’ici 2050, que le pourcentage de Noirs passera à peine de 13,2 % à 14,4 % et que les Américains d’origine asiatique augmenteront leur part de 4,6 % à 7,8 %. Les États-Unis avaient une population de 310 millions d’habitants en octobre 2010 et devraient atteindre 400 millions d’ici 2039 et 439 millions en 2050. [23] [132] [133] [134] Il est en outre prévu que 82 % de la l’augmentation de la population de 2005 à 2050 sera due aux immigrants et à leurs enfants. [135]
Parmi les enfants du pays en 2050, 62 % devraient appartenir à une minorité ethnique, contre 44 % aujourd’hui. Environ 39% devraient être hispaniques ou latinos (contre 22% en 2008) et 38% devraient être des Blancs non hispaniques à race unique (contre 56% en 2008). [136] Les minorités raciales et ethniques ont dépassé les Blancs non hispaniques en tant que groupe le plus important d’enfants américains de moins de 5 ans en 2015. [137]
Projections du Pew Research Center
Les Nations Unies prévoient une population d’un peu plus de 400 millions d’habitants en 2060. [138]
| 1960 | 2005 | 2050 | |
|---|---|---|---|
| Américains blancs | 85% | 67% | 47% |
| Américains d’origine hispanique | 3,5 % | 14% | 29% |
| Noirs américains | 11% | 13% | 14% |
| Américains d’origine asiatique | 0,6 % | 5% | 9% |
| Remarque : toutes les races modifiées et non hispaniques ; Amérindien/Autochtone de l’Alaska non illustré. |
Le profil racial du pays sera très différent, et bien que les Blancs resteront le groupe ethnique le plus important aux États-Unis, ils ne seront plus majoritaires à l’exclusion des Hispaniques blancs d’ici 2055 selon le Pew Research Center . La croissance des populations hispaniques et asiatiques devrait presque tripler au cours des 40 prochaines années. En 2055, la répartition est estimée à 48 % de Blancs non hispaniques, 24 % d’Hispaniques, 16 % de Noirs et 14 % d’Asiatiques. [138]
En 2015 [update], 14 % de la population des États-Unis est née à l’étranger, contre seulement 5 % en 1965. Près de 39 millions d’immigrants sont arrivés aux États-Unis depuis 1965, la plupart venant d’Asie et d’Amérique latine. Le rapport de recensement de 2015 prévoit que le pourcentage de la population américaine née à l’étranger continuera d’augmenter, atteignant 19 % d’ici 2060. Cette augmentation de la population née à l’étranger représentera une part importante de la croissance démographique globale. [138]
La personne moyenne aux États-Unis en 2060 est susceptible d’être plus âgée que la personne moyenne de 2018 aujourd’hui, et près d’une personne sur quatre aura 65 ans ou plus. [138]
Projections du US Census Census Bureau Pourcentage de minorité 1970-2042 (projections 2008) [97]
| Années | 1970 | 1980 | 1990 | 2000 | 2010 | 2020 | 2030 | 2040 | 2042 |
|---|---|---|---|---|---|---|---|---|---|
| Pourcentage de minorité (%) | 16.5 | 20.4 | 24.4 | 30.9 | 36.3 | 39.9 | 44.5 | 49.2 | 50.1 |
Note: “Minority” refers to people who reported their ethnicity and race as something other than non-Hispanic White alone in the decennial census.
Total US population
| Year | Projection (Census Bureau)[23]
(thousands) |
Projection (UN)[140]
(thousands) |
Actual result |
|---|---|---|---|
| 2010 | 310,233 | 309,011 | 308,745,538 |
| 2020 | 341,387 | 331,003 | |
| 2030 | 373,504 | 349,642 | |
| 2040 | 405,655 | 366,572 | |
| 2050 | 439,010 | 379,419 |
LGBT population
The 2000 U.S. Census counted same-sex couples in an oblique way; asking the sex and the relationship to the “main householder”, whose sex was also asked. Community Marketing & Insights, an organization specializing in analyzing gay demographic data, reported, based on this count in the 2000 census and in the 2000 supplementary survey, that same-sex couples comprised between 1.0% and 1.1% of U.S. couples in 2000.[141] A 2006 report issued by The Williams Institute on Sexual Orientation concluded that the number of same-sex couples in the U.S. grew from 2000 to 2005, from nearly 600,000 couples in 2000 to almost 777,000 in 2005.[citation needed] A 2006 UCLA study reported that 4.1% of Americans aged 18–45 identify as gay, lesbian, or bisexual.[142]
A 2011 report by the Williams Institute estimated that 9 million adults identify as gay, lesbian, or bisexual, representing 3.5% of the population over 18.[143] A spokesperson said that, until recently, few studies have tried to eliminate people who had occasionally undertaken homosexual behavior or entertained homosexual thoughts, from people who identified as lesbian or gay.[144] (Older estimates have varied depending on methodology and timing; see Demographics of sexual orientation for a list of studies.)
Foreign-born population
As of 2017, there is a total of 44,525,458 foreign-born people in the United States[145] that represents 13.5% of the total population of the country.
It is important to note that the foreign-born people are not necessarily recent immigrants, in general, Europeans have resided in the United States longer than the total immigrant population, approximately 66 percent of the European immigrants arrived prior to 2000.[146]
| Place of birth | Estimate | Percentage of total foreign-born people |
|---|---|---|
| Americas | 23,241,959 | 52.2% |
| Caribbean | 4,414,943 | 9.9% |
| > Cuba | 1,311,803 | 3.0% |
| > Dominican Republic | 1,162,568 | 2.6% |
| Central America (including Mexico) | 14,796,926 | 33.2% |
| > Mexico | 11,269,913 | 25.3% |
| > El Salvador | 1,401,832 | 3.2% |
| South America | 3,213,187 | 7.2% |
| > Canada | 809,267 | 1.8% |
| Europe | 4,818,662 | 10.8% |
| Northern Europe | 941,796 | 2.1% |
| Western Europe | 949,591 | 2.1% |
| Southern Europe | 761,390 | 1.7% |
| Eastern Europe | 2,153,855 | 4.8% |
| Asia | 13,907,844 | 31.2% |
| Eastern Asia | 4,267,303 | 9.6% |
| > China | 2,639,365 | 5.9% |
| > Korea | 1,064,960 | 2.4% |
| South Central Asia | 4,113,013 | 9.2% |
| > India | 2,348,687 | 5.3% |
| South Eastern Asia | 4,318,647 | 6.7% |
| > Philippines | 1,945,345 | 4.4% |
| > Vietnam | 1,314,927 | 3.0% |
| Western Asia | 1,159,835 | 2.6% |
| Africa | 2,293,028 | 5.2% |
| Eastern Africa | 693,784 | 1.6% |
| Middle Africa | 163,364 | 0.4% |
| Northern Africa | 359,559 | 0.8% |
| Southern Africa | 116,297 | 0.2% |
| Western Africa | 837,290 | 1.9% |
| Oceania | 263,965 | 0.6% |
| Australia and New Zealand Subregion | 123,080 | 0.3% |
Citizens living abroad
As of April 2015, the U.S. State Department estimated that 8.7 million American citizens live overseas. Americans living abroad are not counted in the U.S. Census unless they are a federal government employees or dependents of a federal employee.[147] A 2010 paper estimated the number of civilian Americans living abroad to be around 4 million.[148] So-called “accidental Americans” are citizens of a country other than the United States who may also be considered U.S. citizens or be eligible for U.S. citizenship under specific laws but are not aware of having such status (or became aware of it only recently).[149]
Religion
Religious affiliations
Religion in the United States (2021)[150]
Protestantism (40%) Catholicism (21%) Mormonism (1%) Unaffiliated (29%) Judaism (1%) Islam (1%) Hinduism (1%) Buddhism (1%) Other religions (3%) Unanswered (2%)
The table below is based mainly on selected data as reported to the United States Census Bureau. It only includes the voluntary self-reported membership of religious bodies with 750,000 or more. The definition of a member is determined by each religious body.[151] In 2004[update], the US census bureau reported that about 13% of the population did not identify themselves as a member of any religion.[152] [clarification needed]
In a Pew Research Survey performed in 2012, Americans without a religion (atheists, agnostics, nothing in particular, etc.) approached the numbers of Evangelical Protestant Americans with almost 20% of Americans being nonreligious (compared to just over 26% being Evangelical Protestant). If this current growth rate continues, by 2050, around 51% of Americans will not have a religion.[153]
Surveys conducted in 2014 and 2019 by Pew indicated that the percentage of Americans unaffiliated with a religion increased from 16% in 2007 to 23% in 2014 and 26% of the population in 2019.[154][155]
According to statistical data made by the Pew Research Center in 2020 about 75.5% of the US population is Christian, 18.6% is Unaffiliated, 1.7% is Jewish, 1.2% is Buddhist, 1.1% follows Islam and 1.9% follow other religions such as Hinduism, traditional religions and others. Currently, the United States has the largest Christian population in the world (approximately 230-250 million) and the largest Protestant Christian population (approximately 150-160 million). The country also has the second largest Jewish community in the world (after Israel) and the largest Buddhist and Hindu communities in the West, as well as the largest number of followers of Islam in North America. The country has about 64 million non-affiliates (only China and Japan have more).[citation needed][156]
| Religious body | Year reported |
Places of worship |
Membership (thousands) |
Clergy |
|---|---|---|---|---|
| !a | 0000 | −9999 | −9999 | −9999 |
| African Methodist Episcopal Church | 1999 | no data | 2,500 | 7,741 |
| African Methodist Episcopal Zion Church | 2002 | 3,226 | 1,431 | 3,252 |
| American Baptist Association | 2009 | 1,600[157] | 100[157] | 1,740 |
| Amish, Old Order | 1993 | 898 | 227 | 3,592 |
| American Baptist Churches USA | 2017 | 5,057 | 1,146[158] | 4,145 |
| Antiochian Orthodox Christian Archdiocese of North America | 1998 | 220 | 65 | 263 |
| Armenian Apostolic Church | 2010 | 153 | 1,000 | 200 |
| Armenian Catholic Church | 2010 | 36 | ||
| Assemblies of God | 2018 | 13,017[159] | 1,857[159] | 38,199[159] |
| Baptist Bible Fellowship International | 2010 | 4,000[160] | 1,100[160] | 4,190[160] |
| Baptist General Conference | 1998 | 876 | 141 | no data |
| Baptist Missionary Association of America | 2010 | 1,272[161] | 138[161] | 1,525 |
| Buddhism | 2001 | no data | 1,082 | no data |
| Christian and Missionary Alliance, The | 1998 | 1,964 | 346 | 1,629 |
| Christian Brethren (Plymouth Brethren) | 1997 | 1,150 | 100 | no data |
| Christian Church (Disciples of Christ) | 2018 | 3,624 | 382[162] | 2,066 |
| Christian churches and churches of Christ | 1998 | 5,579 | 1,072 | 5,525 |
| Christian Congregation, Inc., The | 1998 | 1,438 | 117 | 1,436 |
| Christian Methodist Episcopal Church | 1983 | 2,340 | 719 | no data |
| Christian Reformed Church in North America | 1998 | 733 | 199 | 655 |
| Church of God in Christ | 1991 | 15,300 | 5,500 | 28,988 |
| Church of God of Prophecy | 1997 | 1,908 | 77 | 2,000 |
| Church of God (Anderson, IN) | 1998 | 2,353 | 234 | 3,034 |
| Church of God (Cleveland, Tennessee) | 1995 | 6,060 | 753 | 3,121 |
| The Church of Jesus Christ of Latter-day Saints | 2014 | 14,018 | 6,466 | 38,259 |
| Church of the Brethren | 2019 | 978[163] | 99[163] | 827 |
| Church of the Nazarene | 1998 | 5,101 | 627 | 4,598 |
| Churches of Christ | 2019 | 11,989[164] | 1,116[164] | 14,500 |
| Conservative Baptist Association of America | 1998 | 1,200 | 200 | no data |
| Community of Christ | 1998 | 1,236 | 140 | 19,319 |
| Coptic Orthodox Church | 2003 | 200 | 1,000 | 200 |
| A Covenant Order of Evangelical Presbyterians | 2012 | 383 | 130 | 500 |
| Cumberland Presbyterian Church | 1998 | 774 | 87 | 630 |
| Episcopal Church | 2018 | 6,423[165] | 1,676[165] | 8,131 |
| Evangelical Covenant Church, The | 1998 | 628 | 97 | 607 |
| Evangelical Free Church of America, The | 1995 | 1,224 | 243 | 1,936 |
| Evangelical Lutheran Church in America | 2018 | 9,091[166] | 3,363[166] | 9,646 |
| Evangelical Presbyterian Church | 1998 | 187 | 145[167] | 262 |
| Free Methodist Church of North America | 1998 | 990 | 73 | no data |
| Full Gospel Fellowship | 1999 | 896 | 275 | 2,070 |
| General Association of General Baptists | 1997 | 790 | 72 | 1,085 |
| General Association of Regular Baptist Churches | 1998 | 1,415 | 102 | no data |
| U.S. Conference of Mennonite Brethren Churches | 1996 | 368 | 82 | 590 |
| Grace Gospel Fellowship | 1992 | 128 | 60 | 160 |
| Greek Orthodox Archdiocese of America | 2006 | 560[168] | 1,500[168] | 840[168] |
| Hinduism | 2001 | no data | 766 | no data |
| Independent Fundamental Churches of America | 1999 | 659 | 62 | no data |
| International Church of the Foursquare Gospel | 1998 | 1,851 | 238 | 4,900 |
| International Council of Community Churches | 1998 | 150 | 250 | 182 |
| International Pentecostal Holiness Church | 1998 | 1,716 | 177 | 1507 |
| Islam | 2011 | no data | 2,600 | no data |
| Jainism | no data | no data | 50 | no data |
| Jehovah’s Witnesses | 2014 | 13,871 | 1,243 | no data |
| Judaism | 2006 | 3,727 | 6,588 | no data |
| Lutheran Church–Missouri Synod, The | 2017 | 6,046[169] | 1,969[169] | 6,055[169] |
| Macedonian Orthodox Church – Ohrid Archbishopric | 2010 | 19 | 50 | no data |
| Mennonite Church USA | 2005 | 943 | 114 | no data |
| National Association of Congregational Christian Churches | 1998 | 416 | 67 | 534 |
| National Association of Free Will Baptists | 2007 | 2,369[170] | 186[170] | 3,915[170] |
| National Baptist Convention of America, Inc. | 1987 | 2,500 | 3,500 | 8,000 |
| National Baptist Convention, USA, Inc. | 1992 | 33,000 | 8,200 | 32,832 |
| National Missionary Baptist Convention of America | 2004 | 300[171] | 400[171] | no data |
| Orthodox Church in America | 2010 | 750[172] | 131[172] | 970[172] |
| Pentecostal Assemblies of the World, Inc. | 1998 | 1,750 | 1,500 | 4,500 |
| Pentecostal Church of God | 1998 | 1,237 | 104 | no data |
| Pentecostal Church International, United | 2008 | 28,351 | 4,037 | 22,881 |
| Presbyterian Church in America | 1997 | 1,340 | 385[173] | 1,642 |
| Presbyterian Church (U.S.A.) | 2018 | 9,161[174] | 1,245[175] | 19,243[174] |
| Progressive National Baptist Convention, Inc. | 2017 | 1,200[171] | 1,500[171] | no data |
| Reformed Church in America | 2018 | 902 | 200[176] | 915 |
| Religious Society of Friends | 1994 | 1,200 | 104 | no data |
| Roman Catholic Church | 2002 | 19,484 | 66,404 | 50,017 (1997)[177] |
| Romanian Orthodox Episcopate | 1996 | 37 | 65 | 37 |
| Salvation Army, The | 1998 | 1,388 | 471 | 2,920 |
| Scientology | 2005 | 1,300 | 55[178] | 1 |
| Serbian Orthodox Church | 1986 | 68 | 67 | 60 |
| Seventh-day Adventist Church | 1998 | 4,405 | 840 | 2,454 |
| Sikhism | 1999 | 244 | 80 | no data |
| Southern Baptist Convention | 2019 | 47,530[179] | 14,525[179] | 71,520 |
| Unitarian Universalism | 2001 | no data | 629 | no data |
| United Church of Christ | 2016 | 5,000 | 880 | 5,868 |
| United House of Prayer for All People | no data | 100 | 25 | no data |
| United Methodist Church, The | 2018 | 36,170 | 6,672[180] | no data |
| Wesleyan Church, The | 1998 | 1,590 | 120 | 1,806 |
| Wisconsin Evangelical Lutheran Synod | 2018 | 1,281[181] | 359[181] | 1,222 |
| Zoroastrianism | 2006 | no data | 11 | no data |
| ~z | 9999 | 99999999 | 99999999 | 99999999 |
-
![]()
Religious affiliation within each state that has the largest deviation compared to the national average, 2001.
-
![]()
Percentage of state populations that identify with a religion rather than “no religion”, 2014.
-
![]()
Plurality religion by state, 2001. Data is unavailable for Alaska and Hawaii.


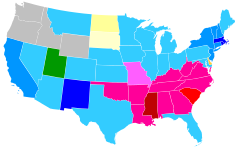
According to Pew Research Center study released in 2018, by 2040, Islam will surpass Judaism to become the second largest religion in the US due to higher immigration and birth rates.[182]
Religions of U.S. adults
The United States government does not collect religious data in its census. The survey below, the American Religious Identification Survey (ARIS) 2008, was a random digit-dialed telephone survey of 54,461 American residential households in the contiguous United States. The 1990 sample size was 113,723; 2001 sample size was 50,281.
Adult respondents were asked the open-ended question, “What is your religion, if any?”. Interviewers did not prompt or offer a suggested list of potential answers. The religion of the spouse or partner was also asked. If the initial answer was “Protestant” or “Christian” further questions were asked to probe which particular denomination. About one-third of the sample was asked more detailed demographic questions.
Religious Self-Identification of the U.S. Adult Population: 1990, 2001, 2008[183]
Figures are not adjusted for refusals to reply; investigators suspect refusals are possibly more representative of “no religion” than any other group.
| Group | 1990 adults × 1,000 |
2001 adults × 1,000 |
2008 adults × 1,000 |
Numerical Change 1990– 2008 as % of 1990 |
1990 % of adults |
2001 % of adults |
2008 % of adults |
change in % of total adults 1990– 2008 |
|---|---|---|---|---|---|---|---|---|
| Adult population, total | 175,440 | 207,983 | 228,182 | 30.1% | ||||
| Adult population, Responded | 171,409 | 196,683 | 216,367 | 26.2% | 97.7% | 94.6% | 94.8% | −2.9% |
| Total Christian | 151,225 | 159,514 | 173,402 | 14.7% | 86.2% | 76.7% | 76.0% | −10.2% |
| Catholic | 46,004 | 50,873 | 57,199 | 24.3% | 26.2% | 24.5% | 25.1% | −1.2% |
| Non-Catholic Christian | 105,221 | 108,641 | 116,203 | 10.4% | 60.0% | 52.2% | 50.9% | −9.0% |
| Baptist | 33,964 | 33,820 | 36,148 | 6.4% | 19.4% | 16.3% | 15.8% | −3.5% |
| Mainline Protestant | 32,784 | 35,788 | 29,375 | −10.4% | 18.7% | 17.2% | 12.9% | −5.8% |
| Methodist | 14,174 | 14,039 | 11,366 | −19.8% | 8.1% | 6.8% | 5.0% | −3.1% |
| Lutheran | 9,110 | 9,580 | 8,674 | −4.8% | 5.2% | 4.6% | 3.8% | −1.4% |
| Presbyterian | 4,985 | 5,596 | 4,723 | −5.3% | 2.8% | 2.7% | 2.1% | −0.8% |
| Episcopalian/Anglican | 3,043 | 3,451 | 2,405 | −21.0% | 1.7% | 1.7% | 1.1% | −0.7% |
| United Church of Christ | 438 | 1,378 | 736 | 68.0% | 0.2% | 0.7% | 0.3% | 0.1% |
| Christian Generic | 25,980 | 22,546 | 32,441 | 24.9% | 14.8% | 10.8% | 14.2% | −0.6% |
| Jehovah’s Witness | 1,381 | 1,331 | 1,914 | 38.6% | 0.8% | 0.6% | 0.8% | 0.1% |
| Christian Unspecified | 8,073 | 14,190 | 16,384 | 102.9% | 4.6% | 6.8% | 7.2% | 2.6% |
| Non-denominational Christian | 194 | 2,489 | 8,032 | 4040.2% | 0.1% | 1.2% | 3.5% | 3.4% |
| Protestant – Unspecified | 17,214 | 4,647 | 5,187 | −69.9% | 9.8% | 2.2% | 2.3% | −7.5% |
| Evangelical/Born Again | 546 | 1,088 | 2,154 | 294.5% | 0.3% | 0.5% | 0.9% | 0.6% |
| Pentecostal/Charismatic | 5,647 | 7,831 | 7,948 | 40.7% | 3.2% | 3.8% | 3.5% | 0.3% |
| Pentecostal – Unspecified | 3,116 | 4,407 | 5,416 | 73.8% | 1.8% | 2.1% | 2.4% | 0.6% |
| Assemblies of God | 617 | 1,105 | 810 | 31.3% | 0.4% | 0.5% | 0.4% | 0.0% |
| Church of God | 590 | 943 | 663 | 12.4% | 0.3% | 0.5% | 0.3% | 0.0% |
| Other Protestant Denomination | 4,630 | 5,949 | 7,131 | 54.0% | 2.6% | 2.9% | 3.1% | 0.5% |
| Seventh-Day Adventist | 668 | 724 | 938 | 40.4% | 0.4% | 0.3% | 0.4% | 0.0% |
| Churches of Christ | 1,769 | 2,593 | 1,921 | 8.6% | 1.0% | 1.2% | 0.8% | −0.2% |
| Mormon/Latter-Day Saints | 2,487 | 2,697 | 3,158 | 27.0% | 1.4% | 1.3% | 1.4% | 0.0% |
| Total non-Christian religions | 5,853 | 7,740 | 8,796 | 50.3% | 3.3% | 3.7% | 3.9% | 0.5% |
| Jewish | 3,137 | 2,837 | 2,680 | −14.6% | 1.8% | 1.4% | 1.2% | −0.6% |
| Eastern Religions | 687 | 2,020 | 1,961 | 185.4% | 0.4% | 1.0% | 0.9% | 0.5% |
| Buddhist | 404 | 1,082 | 1,189 | 194.3% | 0.2% | 0.5% | 0.5% | 0.3% |
| Muslim | 527 | 1,104 | 1,349 | 156.0% | 0.3% | 0.5% | 0.6% | 0.3% |
| New Religious Movements & Others | 1,296 | 1,770 | 2,804 | 116.4% | 0.7% | 0.9% | 1.2% | 0.5% |
| None/ No religion, total | 14,331 | 29,481 | 34,169 | 138.4% | 8.2% | 14.2% | 15.0% | 6.8% |
| Agnostic+Atheist | 1,186 | 1,893 | 3,606 | 204.0% | 0.7% | 0.9% | 1.6% | 0.9% |
| Did Not Know/ Refused to reply | 4,031 | 11,300 | 11,815 | 193.1% | 2.3% | 5.4% | 5.2% | 2.9% |
-
![]()
States in the United States by Catholic population according to the Pew Research Center 2014 Religious Landscape Survey.[184] States with Catholic population greater than the United States as a whole are in full red.
-
![]()
States in the United States by Evangelical Protestant population according to the Pew Research Center 2014 Religious Landscape Survey.[184] States with Evangelical Protestant populations greater than the United States as a whole are in full orange.
-
![]()
States in the United States by Mainline or Black Protestant population according to the Pew Research Center 2014 Religious Landscape Survey.[184] States with Mainline or Black Protestant population greater than the United States as a whole are in full purple.
-
![]()
States in the United States by non-Christian (e.g. Non-religious, Jewish, Muslim, Hindu, Buddhist) population according to the Pew Research Center 2014 Religious Landscape Survey.[184] States with non-Christian populations greater than the United States as a whole are in full blue.
-
![]()
States in the United States by non-Protestant and non-Catholic Christian (e.g. Mormon, Jehovah’s Witness, Eastern Orthodox) population according to the Pew Research Center 2014 Religious Landscape Survey.[184] States with non-Catholic/non-Protestant Christian population greater than the United States as a whole are in full green.

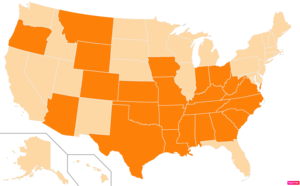

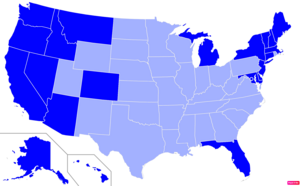

Income
In 2006, the median household income in the United States was around $46,326. Household and personal income depends on variables such as race, number of income earners, educational attainment and marital status.
| Households | Persons, age 25 or older with earnings | Household income by race or ethnicity | |||||||
|---|---|---|---|---|---|---|---|---|---|
| All households | Dual earner households |
Per household member |
Males | Females | Both sexes | Asian | Non-Hispanic White | Hispanic (of any race) |
Black |
| $46,326 | $67,348 | $23,535 | $39,403 | $26,507 | $32,140 | $57,518 | $48,977 | $34,241 | $30,134 |
| Measure | Some High School | High school graduate | Some college | Associate’s degree | Bachelor’s degree or higher | Bachelor’s degree | Master’s degree | Professional degree | Doctorate degree |
| Persons, age 25+ w/ earnings | $20,321 | $26,505 | $31,054 | $35,009 | $49,303 | $43,143 | $52,390 | $82,473 | $70,853 |
| Male, age 25+ w/ earnings | $24,192 | $32,085 | $39,150 | $42,382 | $60,493 | $52,265 | $67,123 | $100,000 | $78,324 |
| Female, age 25+ w/ earnings | $15,073 | $21,117 | $25,185 | $29,510 | $40,483 | $36,532 | $45,730 | $66,055 | $54,666 |
| Persons, age 25+, employed full-time | $25,039 | $31,539 | $37,135 | $40,588 | $56,078 | $50,944 | $61,273 | $100,000 | $79,401 |
| Household | $22,718 | $36,835 | $45,854 | $51,970 | $73,446 | $68,728 | $78,541 | $100,000 | $96,830 |
| Bottom 10% | Bottom 20% | Bottom 25% | Middle 33% | Middle 20% | Top 25% | Top 20% | Top 5% | Top 1.5% | Top 1% |
| $0 to $10,500 | $0 to $18,500 | $0 to $22,500 | $30,000 to $62,500 | $35,000 to $55,000 | $77,500 and up | $92,000 and up | $167,000 and up | $250,000 and up | $350,000 and up |
| Source: US Census Bureau, 2006; income statistics for the year 2005 |
-
![]()
Counties in the United States by the percentage of the over 25-year-old population with bachelor’s degrees according to the U.S. Census Bureau American Community Survey 2013–2017 5-Year Estimates.[185] Counties with higher percentages of bachelor’s degrees than the United States as a whole are in full orange.
-
![]()
States in the United States by the percentage of the over 25-year-old population with bachelor’s degrees according to the U.S. Census Bureau American Community Survey 2013–2017 5-Year Estimates.[185] States with higher percentages of bachelor’s degrees than the United States as a whole are in full orange.
-
![]()
Counties in the United States by per capita income according to the U.S. Census Bureau American Community Survey 2013–2017 5-Year Estimates.[186] Counties with per capita incomes higher than the United States as a whole are in full green.
-
![]()
States in the United States by per capita income according to the U.S. Census Bureau American Community Survey 2013–2017 5-Year Estimates.[186] States with per capita incomes higher than the United States as a whole are in full green.
-
![]()
Counties in the United States by median nonfamily household income according to the U.S. Census Bureau American Community Survey 2013–2017 5-Year Estimates.[186] Counties with median nonfamily household incomes higher than the United States as a whole are in full green.
-
![]()
States in the United States by median nonfamily household income according to the U.S. Census Bureau American Community Survey 2013–2017 5-Year Estimates.[186] States with median nonfamily household incomes higher than the United States as a whole are in full green.
-
![]()
Counties in the United States by median family household income according to the U.S. Census Bureau American Community Survey 2013–2017 5-Year Estimates.[186] Counties with median family household incomes higher than the United States as a whole are in full green.
-
![]()
States in the United States by median family household income according to the U.S. Census Bureau American Community Survey 2013–2017 5-Year Estimates.[186] States with median family household incomes higher than the United States as a whole are in full green.


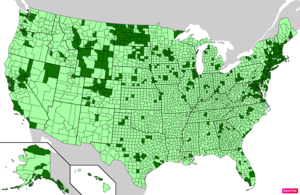
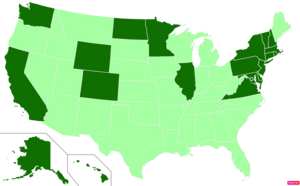


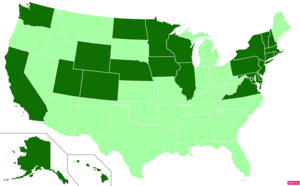
Economic class
Social classes in the United States lack distinct boundaries and may overlap. Even their existence (when distinguished from economic strata) is controversial. The following table provides a summary of some prominent academic theories on the stratification of American society:
| Dennis Gilbert, 2002 | William Thompson & Joseph Hickey, 2005 | Leonard Beeghley, 2004 | |||
|---|---|---|---|---|---|
| Class | Typical characteristics | Class | Typical characteristics | Class | Typical characteristics |
| Capitalist class (1%) | Top-level executives, high-rung politicians, heirs. Ivy League education common. | Upper class (1%) | Top-level executives, celebrities, heirs; income of $500,000+ common. Ivy league education common. | The super-rich (0.9%) | Multi-millionaires whose incomes commonly exceed $3.5 million or more; includes celebrities and powerful executives/politicians. Ivy League education common. |
| Upper middle class[1] (15%) | Highly-educated (often with graduate degrees), most commonly salaried, professionals and middle management with large work autonomy. | Upper middle class[1] (15%) | Highly-educated (often with graduate degrees) professionals & managers with household incomes varying from the high 5-figure range to commonly above $100,000. | The rich (5%) | Households with net worth of $1 million or more; largely in the form of home equity. Generally have college degrees. |
| Middle class (plurality/ majority?; ca. 46%) |
College-educated workers with considerably higher-than-average incomes and compensation; a man making $57,000 and a woman making $40,000 may be typical. | ||||
| Lower middle class (30%) | Semi-professionals and craftsmen with a roughly average standard of living. Most have some college education and are white-collar. | Lower middle class (32%) | Semi-professionals and craftsmen with some work autonomy; household incomes commonly range from $35,000 to $75,000. Typically, some college education. | ||
| Working class (30%) | Clerical and most blue-collar workers whose work is highly routinized. Standard of living varies depending on number of income earners, but is commonly just adequate. High school education. | ||||
| Working class (32%) | Clerical, pink- and blue-collar workers with often low job security; common household incomes range from $16,000 to $30,000. High school education. | Working class (ca. 40–45%) |
Blue-collar workers and those whose jobs are highly routinized with low economic security; a man making $40,000 and a woman making $26,000 may be typical. High school education. | ||
| Working poor (13%) | Service, low-rung clerical and some blue-collar workers. High economic insecurity and risk of poverty. Some high school education. | ||||
| Lower class (ca. 14–20%) | Those who occupy poorly-paid positions or rely on government transfers. Some high school education. | ||||
| Underclass (12%) | Those with limited or no participation in the labor force. Reliant on government transfers. Some high school education. | The poor (ca. 12%) | Those living below the poverty line with limited to no participation in the labor force; a household income of $18,000 may be typical. Some high school education. | ||
| References: Gilbert, D. (2002) The American Class Structure: In An Age of Growing Inequality. Belmont, CA: Wadsworth, ISBN 0534541100. (see also Gilbert Model); Thompson, W. & Hickey, J. (2005). Society in Focus. Boston, MA: Pearson, Allyn & Bacon; Beeghley, L. (2004). The Structure of Social Stratification in the United States. Boston, MA: Pearson, Allyn & Bacon. 1 The upper middle class may also be referred to as “Professional class” Ehrenreich, B. (1989). The Inner Life of the Middle Class. NY, NY: Harper-Collins. |
Generational cohorts
A definitive recent study of US generational cohorts was done by Schuman and Scott (2012) in which a broad sample of adults of all ages was asked, “What world events are especially important to you?”[187] They found that 33 events were mentioned with great frequency. When the ages of the respondents were correlated with the expressed importance rankings, seven (some put 8 or 9) distinct cohorts became evident.
Today the following descriptors are frequently used for these cohorts:
- Lost Generation – born from approximately 1883 to 1900.
- Greatest Generation – born from approximately 1901 to 1927[188] (in the U.S., this was the “Depression cohort” who fought and won World War II).
- Silent Generation – born from approximately 1928 to 1945[189] during the Great Depression and World War II.[190] The label was originally applied to people in North America but has also been applied to those in Western Europe, Australasia and South America. It includes most of those who fought during the Korean War.
- Baby boomers (also known as Boomers) – born from 1946 to 1964.[189]
- Generation X – born from approximately 1965 to 1980.[189][191] In the U.S., some called Xers the “baby bust” generation because of the drop in birth rates following the baby boom.[192]
- Millennials (also known as Generation Y) – born from approximately 1981 to 1996.[189]
- Generation Z (also known as iGeneration, Digital Natives, or Zoomers) – born from approximately 1997 to 2012.[189]
- Generation Alpha – born from approximately the early 2010s to mid-2020s.[193]
U.S. demographic birth cohorts
Birth rate, death rate and natural increase rate in the United States 1935–2020
Subdivided groups are present when peak boom years or inverted peak bust years are present, and may be represented by a normal or inverted bell-shaped curve (rather than a straight curve). The boom subdivided cohorts may be considered as “pre-peak” (including peak year) and “post-peak”. The year 1957 was the baby boom peak with 4.3 million births and 122.7 fertility rate. Although post-peak births (such as trailing edge boomers) are in decline, and sometimes referred to as a “bust”, there are still a relatively large number of births. The dearth-in-birth bust cohorts include those up to the valley birth year, and those including and beyond, leading up to the subsequent normal birth rate. The baby boom began around 1943 to 1946.[citation needed]
From the decline in U.S. birth rates starting in 1958 and the introduction of the birth control pill in 1960, the Baby Boomer normal distribution curve is negatively skewed. The trend in birth rates from 1958 to 1961 show a tendency to end late in the decade at approximately 1969, thus returning to pre-WWII levels, with 12 years of rising and 12 years of declining birth rates. Pre-war birth rates were defined as anywhere between 1939 and 1941 by demographers such as the Taeuber’s, Philip M. Hauser and William Fielding Ogburn.[194]
Demographic statistics
Birth, growth, death rates, and marriage rates
Births, deaths and natural increase in the United States 1935–2020  Marriages, Families & Intimate Relationships in the US, 1970–2000
According to the U.S. Census Bureau, in 2021, the population of the United States grew at a slower rate than in any other year since the country’s founding.[195] The U.S. population grew only 0.1% from the previous year before.[195] The United States’ population has grown by less than one million people for the first time since 1937, with the lowest numeric growth since at least 1900, when the Census Bureau began yearly population estimates.[195] Apart from the previous few years, when population growth plummeted to historically low levels, the slowest pace of increase in the twentieth century occurred between 1918 and 1919, when the influenza epidemic and World War I were both in full swing.[195] Slower population growth has been the norm in the United States for some years, owing to lower fertility and net international migration, as well as rising mortality from an aging population.[195]
To put it another way, since the mid-2010s, births and net international migration have been dropping while deaths have risen. These trends have a cumulative effect of reduced population increase.[195]
The COVID-19 pandemic has accelerated this trend, resulting in a historically slow population increase in 2021.
The growth rate is 0.1% as estimated for 2021.[195]
The birth rate is 11.0 births/1,000 population, as of 2020.[34] This was the lowest birth rate since records began. There were 3,613,647 births in 2020, this was the lowest number of births since 1980.[34]
11.0 births/1,000 population per year (final data for 2020). 11.4 births/1,000 population per year (final data for 2019). [34]
In 2020, the CDC reported that there were 1,676,911 marriages in 2020, compared to 2019, there were 2,015,603 marriages.[196] Marriage rates varied significantly by state, ranging from 3.2 marriages/1,000 population in California to 21.0 marriages/1,000 population in Nevada.*[197]
- 5.1 marriages/1,000 population per year (provisional data for 2020).[196]
- 6.1 marriages/1,000 population per year (provisional data for 2019).[196]
*Rates are based on provisional counts of marriages by state of occurrence
In 2009, Time magazine reported that 40% of births were to unmarried women.[198] The following is a breakdown by race for unwed births: 17% Asian, 29% White, 53% Hispanics (of any race), 66% Native Americans, and 72% Black American.[199]
According to the CDC, in 2020, there were at least, 1,461,121 births to unmarried women. In 2020, 40.5% of births were to unmarried women. The following is breakdown by race for unwed births: 28.4% Non-Hispanic White, 70.4% Non-Hispanic Black, and 52.8% Hispanic (of any race).[200]
The drop in the birth rate from 2007 to 2009 is believed to be associated with the Great Recession.[201]
A study by the Agency for Healthcare Research and Quality (AHRQ) found that more than half (51 percent) of live hospital births in 2008 and 2011 were male.[202]
Per U.S. federal government data released in March 2011, births fell 4% from 2007 to 2009, the largest drop in the U.S. for any two-year period since the 1970s.[203] Births have declined for three consecutive years, and are now 7% below the peak in 2007.[204] This drop has continued through 2010, according to data released by the U.S. National Center for Health Statistics in June 2011.[205] Numerous experts have suggested that this decline is largely a reflection of unfavorable economic conditions.[206] This connection between birth rates and economic downturns partly stems from the fact that American birth rates have now fallen to levels that are comparable to the Great Depression of the 1930s.[207] Teen birth rates in the U.S. are at the lowest level in U.S. history.[208] In fact, teen birth rates in the U.S. have consistently decreased since 1991 through 2011, except for a brief increase between 2005 and 2007.[208] The other aberration from this otherwise steady decline in teen birth rates is the 6% decrease in birth rates for 15- to 19-year-olds between 2008 and 2009.[208] Despite these years of decrease, U.S. teen birth rates are still higher than in other developed nations.[208] Racial differences prevail with teen birth and pregnancy rates as well. The American Indian/Alaska native, Hispanic, and non-Hispanic Black teen pregnancy rates are more than double the non-Hispanic white teen birth rate.[209]
| Age group (2010) | Total (of population) |
White alone (of race/age group) |
Black alone (of race/age group) |
Mixed and/or Some Other Race (of race/age group) |
Asian alone (of race/age group) |
Either American Indian or Alaska native (of race/age group) |
Either Native Hawaiian or Other Pacific Islander (of race/age group) |
|---|---|---|---|---|---|---|---|
| Total | 308745538 (100%) |
223553265 (72.4%) |
38929319 (12.6%) |
28116441 (9.1%) |
14674252 (4.9%) |
2932248 (1.0%) |
540013 (0.2%) |
| 0–4 | 20201362 (6.5%) |
12795675 (5.7%/63.3%) |
2902590 (7.5%/14.4%) |
3315480 (11.8%/16.4%) |
898011 (6.1%/4.5%) |
244615 (8.3%/1.2%) |
44991 (8.3%/0.2%) |
| 5–9 | 20348657 (6.6%) |
13293799 (5.9%/65.3%) |
2882597 (7.4%/14.2%) |
2957487 (10.5%/14.5%) |
928248 (6.3%/4.6%) |
243259 (8.3%/1.2%) |
43267 (8.0%/0.0%) |
| 10–14 | 20677194 (6.7%) |
13737332 (6.1%/66.4%) |
3034266 (7.8%/14.7%) |
2736570 (9.7%/13.2%) |
881590 (6.0%/4.3%) |
245049 (8.4%/1.19%) |
42387 (7.8%/0.2%) |
| 15–19 | 22040343 (7.1%) |
14620638 (6.5%/66.4%) |
3448051 (8.9%/15.6%) |
2704571 (9.6%/12.3%) |
956028 (6.5%/4.3%) |
263805 (9.0%/1.2%) |
47250 (8.7%/0.2%) |
| 20–24 | 21585999 (7.0%) |
14535947 (6.5%/67.3%) |
3111397 (8.0%/14.4%) |
2538967 (9.0%/11.8%) |
1106222 (7.5%/5.1%) |
240716 (8.2%/1.1%) |
52750 (9.8%/0.2%) |
| 25–29 | 21101849 (6.8%) |
14345364 (6.4%/68.0%) |
2786254 (7.2%/13.2%) |
2464343 (8.8%/11.7%) |
1234322 (8.4%/5.9%) |
221654 (7.6%/1.1%) |
49912 (9.2%/0.2%) |
| 30–34 | 19962099 (6.5%) |
13573270 (6.1%/68.0%) |
2627925 (6.8%/13.2%) |
2273322 (8.1%/11.4%) |
1240906 (8.5%/6.2%) |
202928 (6.9%/1.0%) |
43748 (8.1%/0.2%) |
| 35–39 | 20179642 (6.5%) |
13996797 (6.3%/69.36%) |
2613389 (6.7%/13.0%) |
2038408 (7.2%/10.1%) |
1296301 (8.8%/6.4%) |
196017 (6.7%/1.0%) |
38730 (7.2%/0.2%) |
| 40–44 | 20890964 (6.8%) |
15052798 (6.7%/72.1%) |
2669034 (6.9%/12.8%) |
1782463 (6.3%/8.5%) |
1155565 (7.9%/5.5%) |
194713 (6.6%/0.9%) |
36391 (6.7%/0.2%) |
| 45–49 | 22708591 (7.4%) |
17028255 (7.6%/75.0%) |
2828657 (7.3%/12.5%) |
1532117 (5.4%/6.8%) |
1076060 (7.3%/4.7%) |
207857 (7.1%/0.9%) |
35645 (6.6%/0.2%) |
| 50–54 | 22298125 (7.2%) |
17178632 (7.7%/77.0%) |
2694247 (6.9%/12.1%) |
1222175 (4.3%/5.5%) |
980282 (6.7%/4.4%) |
191893 (6.5%/0.9%) |
30896 (5.7%/0.1%) |
| 55–59 | 19664805 (6.4%) |
15562187 (7.0%/79.1%) |
2205820 (5.7%/11.2%) |
873943 (3.1%/4.4%) |
844490 (5.8%/4.3%) |
154320 (5.3%/0.8%) |
24045 (4.5%/0.1%) |
| 60–64 | 16817924 (5.4%) |
13693334 (6.1%/81.4%) |
1686695 (4.3%/10.0%) |
611144 (2.2%/3.6%) |
689601 (4.7%/4.1%) |
118362 (4.0%/0.7%) |
18788 (3.5%/0.1%) |
| 65–69 | 12435263 (4.0%) |
10313002 (4.6%/82.9%) |
1162577 (3.0%/9.4%) |
394208 (1.4%/3.2%) |
474327 (3.2%/3.8%) |
79079 (2.7%/0.6%) |
12070 (2.2%/0.1%) |
| 70–74 | 9278166 (3.0%) |
7740932 (3.5%/83.4%) |
852317 (2.2%/9.2%) |
268574 (1.0%/2.9%) |
354268 (2.4%/3.8%) |
53926 (1.8%/0.6%) |
8149 (1.5%/0.1%) |
| 75–79 | 7317795 (2.4%) |
6224569 (2.8%/85.1%) |
616789 (1.6%/8.4%) |
184596 (0.7%/2.5%) |
251210 (1.7%/3.4%) |
35268 (1.2%/0.5%) |
5363 (1.0%/0.1%) |
| 80–84 | 5743327 (1.9%) |
5002427 (2.2%/87.1%) |
424592 (1.1%/7.4%) |
122249 (0.4%/2.1%) |
168879 (1.2%/2.9%) |
21963 (0.7%/0.4%) |
3217 (0.6%/0.1%) |
| 85+ | 5493433 (1.8%) |
4858307 (2.2%/88.4%) |
382122 (1.0%/7.0%) |
95824 (0.3%/1.7%) |
137942 (0.9%/2.5%) |
16824 (0.6%/0.3%) |
2414 (0.4%/0.0%) |
 U.S. unemployment by state in December 2015 (official, or U3 rate). [210] <3.0% <3.5% <4.0% <4.5% <5.0% <5.5% <6.0% <6.5% ≥6.5%
For those interested in a look at where the U.S. population is headed over a longer term, the link below to a recent article offers a preliminary overview of census trends. Yes, a multi-racial democracy awaits, if we can keep it, but also a society with significant demographic pitfalls. Here is a quote summarizing key points:
These trends include an unprecedented stagnation in population growth, a continued decrease in Americans’ geographical mobility, more pronounced population aging, a first-time decline in the size of the white population, and rising racial and ethnic diversity among millennials, Gen Z, and younger groups, which now comprise a majority of the nation’s residents.[211]
Unemployment rate (seasonally adjusted)
As of July 2020[update], the U.S. unemployment rate was 10.2 percent (U3 rate).
As of July 2019[update], the U.S. unemployment rate was 3.7 percent (U3 rate).
As of July 2018[update], the U.S. unemployment rate was 3.7 percent (U3 rate).
As of July 2017[update], the U.S. unemployment rate was 4.3 percent (U3 rate).[212]
As of July 2016[update], the U.S. unemployment rate was 4.9 percent (U3 rate).[212]
As of July 2015[update], the U.S. unemployment rate was 5.3 percent (U3 rate).[213]
As of July 2014[update], the U.S. unemployment rate was 6.2 percent (U3 rate).[212]
The U6 unemployment rate as of April 2017[update] was 8.6 percent.[214] The U6 unemployment rate counts not only people without work seeking full-time employment (the more familiar U3 rate), but also counts “marginally attached workers and those working part-time for economic reasons.” Note that some of these part-time workers counted as employed by U6 could be working as little as an hour a week. And the “marginally attached workers” include those who have become discouraged and stopped looking, but still want to work. The age considered for this calculation is 16 years and over.
Urban Americans have more job opportunities than those in more rural areas. From 2008 to 2018, 72% of the nation’s employment growth occurred in cities with more than one million residents, which account for 56% of the overall population.[215]
Mobility
In 2021, 27.1 million Americans said they were living in a different place than a year before, compared to 29.8 million in 2020. This reflects an 8.4% mover rate, the lowest recorded in more than 70 years.[216]
See also
-
![icon]() Geography portal
Geography portal -
![icon]() Society portal
Society portal -
![flag]() United States portal
United States portal
- Demographic history of the United States
- Emigration from the United States
- Historical Statistics of the United States
- Historical racial and ethnic demographics of the United States
- Index of United States–related articles
- Languages of the United States
- Maps of American ancestries
- Outline of the United States
- Places in the United States with notable demographic characteristics
- Urbanization in the United States
Lists
- Births of U.S. states and territories by race/ethnicity
- List of metropolitan areas in the Americas
- List of U.S. states and territories by fertility rate
- List of U.S. states and territories by population
- Lists of U.S. cities with non-white majority populations
Income
- Affluence in the United States
- Household income in the United States
- List of highest-income counties in the United States
- List of lowest-income counties in the United States
- Personal income in the United States
Population
- List of metropolitan statistical areas
- List of United States counties and county equivalents
- Office of Management and Budget
- Statistical area (United States)
- Combined Statistical Area
- Core Based Statistical Area
- List of Core Based Statistical Areas
- Metropolitan Statistical Area
- Micropolitan Statistical Area
- Primary statistical area
- List of primary statistical areas of the United States
- Statistical area (United States)
- United States urban area
- List of United States urban areas
Notes
- ^ In fertility rates, 2.1 and above is a stable population and has been marked blue, 2 and below leads to an aging population and the result is that the population decreases.
References
- ^ a b c “New Vintage 2021 Population Estimates Available for the Nation, States and Puerto Rico”. United States Census Bureau. December 21, 2021. Retrieved February 1, 2022.
- ^ a b c d e f g h “NORTH AMERICA :: UNITED STATES”. CIA.gov. Central Intelligence Agency. Retrieved February 11, 2020.
![Public Domain]() This article incorporates text from this source, which is in the public domain .
This article incorporates text from this source, which is in the public domain . - ^ a b Arias, Elizabeth; Tejada-Vera, Betzaida; Ahmad, Farida; Kochanek, Kenneth D. (July 2021). “Provisional Life Expectancy Estimates for 2020” (PDF). cdc.gov.
- ^ a b c Murphy, Sherry; Kochanek, Kenneth; Xu, Jiaquan; Arias, Elizabeth. “Mortality in the United States, 2020” (PDF). NCHS Data Brief. CDC. Retrieved March 1, 2022.
- ^ a b Martin, Joyce A.; Hamilton, Brady E.; Osterman, Michelle J. K. (May 5, 2021). “Births: Provisional Data for 2020” (PDF). Cdc.gov. Retrieved May 5, 2021.
- ^ a b c d Howden, Lindsay M.; Meyer, Julie A. (May 2011). “Age and Sex Composition: 2010” (PDF). United States Census Bureau. p. 6.
- ^ Kaczke, Lisa (March 25, 2019). “South Dakota recognizes official indigenous language”. Argus Leader.
- ^ http://www.rnzi.com/pages/news.php?op=read&id=42333 “Samoa now an official language of instruction in American Samoa”. Radio New Zealand International. 2008-10-03.
- ^ https://www.britannica.com/place/Guam “Guam”. Encyclopaedia Britannica. 2018-10-24.
- ^ https://www.britannica.com/place/Northern-Mariana-Islands “Northern Mariana Islands”. Encyclopaedia Britannica. 2018-10-19.
- ^ http://www.languagepolicy.net/archives/can-pr.htm Crawford, James. “Puerto Rico and Official English”. languagepolicy.net. Retrieved April 27, 2011.
- ^ a b c d “Population Clock”. United States Census Bureau.
- ^ “CIA World Factbook – Field Listing – Population growth rate”. CIA. Retrieved January 9, 2012.
![Public Domain]() This article incorporates text from this source, which is in the public domain .
This article incorporates text from this source, which is in the public domain . - ^ a b “Statistical Abstract of the United States” (PDF). U.S. Census Bureau. 2005. Retrieved October 25, 2015.
- ^ “U.S. population hits 300 million mark”. MSNBC. Associated Press. October 17, 2006. Archived from the original on October 17, 2006. Retrieved October 17, 2006.
- ^ “Modern Immigration Wave Brings 59 Million to U.S. – Pew Research Center”. Pew Research Center’s Hispanic Trends Project. September 28, 2015.
- ^ “Changing Patterns in U.S. Immigration and Population”. pewtrusts.org. December 18, 2014.
- ^ “Annual Report 2021”. USAFacts.
- ^ “Children of color projected to be majority of U.S. youth this year”. PBS NewsHour. January 9, 2020.
- ^ Bureau, US Census. “Racial and Ethnic Diversity in the United States: 2010 Census and 2020 Census”. Census.gov. Retrieved March 3, 2022.
- ^ “U.S. Census Bureau: Minority Population Tops 100 Million”. Archived from the original on September 18, 2008.
- ^ “U.S. Population Projections: 2005–2050”. Pewhispanic.org. Pew Hispanic Center. February 11, 2008. Retrieved September 19, 2011.
- ^ a b c “United States Population Projections: 2000 to 2050” (PDF). U.S. Census Bureau. Retrieved June 6, 2019.
- ^ “World population projected to reach 9.7 billion by 2050”. UN Department of Economic and Social Affairs. July 29, 2015.
- ^ “World Population Prospects: The 2006 Revision, Highlights, Working Paper No. ESA/P/WP.202; Table A.2” (PDF). United Nations, Department of Economic and Social Affairs, Population Division (2007). Retrieved January 10, 2009.
- ^ a b Martin, Joyce A.; Hamilton, Brady E.; Ventura, Stephanie J.; Osterman, Michelle J. K.; Wilson, Elizabeth C.; Mathews, T.J. (August 28, 2012), “Births: Final Data for 2010” (PDF), National Vital Statistics Reports, Cdc.gov, vol. 61, no. 1, pp. 1–72, PMID 24974589
- ^ a b c “DP05 – ACS DEMOGRAPHIC AND HOUSING ESTIMATES”. U.S. Census Bureau. Archived from the original on February 14, 2020. Retrieved October 17, 2019.
- ^ “GCT-PH1 – Population, Housing Units, Area, and Density: 2010 – United States – States; and Puerto Rico”. U.S. Census Bureau. Archived from the original on February 14, 2020. Retrieved October 17, 2019.
- ^ a b “PEPANNRES – Annual Estimates of the Resident Population: April 1, 2010 to July 1, 2018”. U.S. Census Bureau. Archived from the original on February 14, 2020. Retrieved October 17, 2019.
- ^ “US Population Rises to 331,449,281, Census Bureau Says”. U.S. News and World Report. Retrieved May 10, 2021.
- ^ a b Statistical abstract of the united states, 1951, p8, Est. population of continental US excluding oversea armed forces
- ^ a b Current population reports, 1962, p2
- ^ Bureau, US Census. “Age and Sex Composition in the United States: 2019”. The United States Census Bureau. Retrieved August 15, 2021.
- ^ a b c d e f g h i j “Births: Final Data for 2020” (PDF). CDC. Archived (PDF) from the original on February 7, 2022.
- ^ “Deaths and Mortality”. CDC. April 19, 2022.{{cite web}}: CS1 maint: url-status (link)
- ^ Jay Weinstein; Vijayan K. Pillai (2016), Demography: The Science of Population (Second ed.), p. 208, ISBN 9781442235212
- ^ Alesha E. Doan (2007). Opposition and Intimidation:The abortion wars and strategies of political harassment. University of Michigan. p. 40. ISBN 9780472099757.
- ^ “The historically low birthrate, explained in 3 charts”. Vox. May 22, 2018. Retrieved December 27, 2018.
- ^ Stone, Lyman (May 16, 2018). “Baby Bust: Fertility is Declining the Most Among Minority Women”. Institute for Family Studies. Retrieved December 27, 2018.
- ^ US life expectancy has been declining. Here’s why Upton Saiidi, CNBC Markets, July 9, 2019
- ^ Greenhalgh, Jane (July 21, 2021). “U.S. Life Expectancy Fell By 1.5 Years In 2020, The Biggest Drop Since WWII”. NPR. Retrieved August 15, 2021.
- ^ “United States Life Tables, 2018” (PDF). CDC. November 17, 2020.
- ^ “Table 13. State Population – Rank, Percent Change, and Population Density”. U.S. Census Bureau. 2008. Archived from the original (Excel) on September 23, 2015. Retrieved October 24, 2010.
- ^ “Mean Center of Population for the United States: 1790 to 2000” (PDF). U.S. Census Bureau. Archived from the original (PDF) on November 3, 2001. Retrieved October 24, 2010.
- ^ “Annual Estimates of the Resident Population for Incorporated Places over 110,000, Ranked by July 1, 2009 Population: April 1, 2000 to July 1, 2009 (SUB-EST2009-01)”. U.S. Census Bureau. Archived from the original on October 18, 2010. Retrieved May 19, 2011.
- ^ The World Factbook CIA World Factbook. Puerto Rico. Retrieved July 1, 2020.
- ^ The World Factbook CIA World Factbook. Northern Mariana Islands. Retrieved July 1, 2020.
- ^ The World Factbook CIA World Factbook. American Samoa. Retrieved July 1, 2020.
- ^ a b c “Births: Final Data for 2014” (PDF). Cdc.gov. Retrieved October 3, 2017.
- ^ “National Vital Statistics Reports. Births: Final Data for 2015” (PDF). Cdc.gov. Retrieved October 3, 2017.
- ^ Susan Perry (January 11, 2019). “U.S. fertility rate continues to decline, reaching lowest level in 40 years”. MinnPost.
- ^ “NVSS – Birth Data”. www.cdc.gov. June 14, 2021.
- ^ Steven A. Camarota; Karen Zeigler. “The Declining Fertility of Immigrants and Natives” (PDF). Cis.org. Retrieved October 3, 2017.
- ^ a b c Radford, Jynnah (June 17, 2019). “Key findings about U.S. immigrants”. Pew Research Center.
- ^ a b Jens Manuel Krogstad (October 7, 2019). “Key facts about refugees to the U.S.” Pew Research Center.
- ^ “US and World Population Clock”. United States Census Bureau. Retrieved February 7, 2022.
- ^ Radford, Jynnah (June 17, 2019). “Key findings about U.S. immigrants”. FactTank – News in the Numbers. Pew Research Center. Retrieved January 12, 2020.
- ^ “Largest region-of-birth group of immigrants in US” (PDF). Census.gov. Archived from the original (PDF) on February 9, 2015. Retrieved October 3, 2017.
- ^ “Latin America: Introduction”. sites.fas.harvard.edu.
- ^ a b c “Table 3. Persons Obtaining Lawful Permanent Resident Status by Region and Country of Birth: Fiscal Years 2018 to 2020”. Yearbook of Immigration Statistics. Department of Homeland Security. January 6, 2022. Retrieved February 7, 2021.
- ^ “Frequently Requested Statistics on Immigrants and Immigration in the United States”. Migration Policy Institute. March 14, 2019.
- ^ “Table 1. Persons Obtaining Lawful Permanent Resident Status: Fiscal Years 1820 to 2018”. Yearbook of Immigration Statistics. Department of Homeland Security. December 19, 2019. Retrieved January 12, 2020.
- ^ “Table 6. Persons Obtaining Lawful Permanent Resident Status by Type and Major Class of Admission: Fiscal Years 2018 to 2020”. Yearbook of Immigration Statistics. Department of Homeland Security. December 19, 2019. Retrieved February 7, 2022.
- ^ “United States of America: historical demographical data of the whole country”. Population Statistics. Jan Lahmeyer. January 22, 2000. Archived from the original on July 23, 2019. Retrieved October 16, 2013.
- ^ “Data Access – Vital Statistics Online”. www.cdc.gov. May 13, 2019.
- ^ 1960 to 2011 “United States – Death rate: Death rate, crude (per 1,000 people)”. Index Mundi. IndexMundi. Retrieved October 24, 2013.
- ^ a b HISTORICAL STATISTICS of the United States – COLONIAL TIMES TO 1970 – Part 1 (PDF) (Bicentennial ed.), U.S. Department of Commerce. Bureau of Census, 1975, pp. 19, 50
- ^ “National Vital Statistics Reports. Births: Final Data for 2017” (PDF). Cdc.gov. Retrieved December 27, 2018.
- ^ “Products – Data Briefs – Number 328 – November 2018”. www.cdc.gov. June 7, 2019.
- ^ “2019 U.S. Population Estimates Continue to Show the Nation’s Growth Is Slowing”. U.S. Census Bureau. December 30, 2019. Retrieved December 30, 2019.
- ^ “Mortality in the United States, 2018”. Centers for Disease Control and Prevention. January 29, 2020. Retrieved January 30, 2020.
- ^ “COVID-19 Coding and Reporting Guidance – Monthly Birth Counts for Maternal Coronavirus Disease (COVID-19)”. www.cdc.gov. March 8, 2021. Retrieved March 13, 2021.
- ^ No. 427, NCHS Data Brief. “Mortality in the United States, 2020” (PDF). data.cdc.gov. Archived (PDF) from the original on December 22, 2021. Retrieved December 21, 2021.
- ^ “Provisional Death Counts for Coronavirus Disease 2019 (COVID-19)”. www.cdc.gov. March 15, 2022. Retrieved March 15, 2022.
- ^ “State and National Provisional Counts”. Retrieved April 13, 2022.
- ^ “State and National Provisional Counts”. www.cdc.gov. Retrieved April 19, 2022.
- ^ Bureau, US Census. “Population Projections”. The United States Census Bureau.
- ^ Census, Us. “Decennial Census by Decades”. Retrieved April 27, 2021.
- ^ “Chapter Z Colonial and Pre-Federal Statistics” (PDF).
- ^ Resident Population Data. “Resident Population Data – 2010 Census”. www.census.gov. Retrieved February 22, 2013.
- ^ Historical Census Statistics on Population Totals By Race, 1790 to 1990… Archived July 25, 2008, at the Wayback Machine. U.S. Census Bureau. Retrieved May 28, 2013.
- ^ “Demographics Trends in the 20th Century Archived January 20, 2012, at the Wayback Machine”. U.S. Census Bureau.
- ^ “We the Americans: Blacks”. Census.gov.
- ^ “Latinos and the Changing Face of America – Population Reference Bureau Archived May 19, 2012, at the Wayback Machine”
- ^ “Not Just Black and White: Historical and Contemporary Perspectives on Immigration, Race, and Ethnicity in the United States“. Nancy Foner, George M. Fredrickson (2005). p. 120. ISBN 0-87154-270-6
- ^ “Immigrants in the United States and the Current Economic Crisis”, Demetrios G. Papademetriou and Aaron Terrazas, Migration Policy Institute, April 2009.
- ^ “Immigration Worldwide: Policies, Practices, and Trends“. Uma A. Segal, Doreen Elliott, Nazneen S. Mayadas (2010). Oxford University Press US. p. 32. ISBN 0-19-538813-5
- ^ Borjas, George J. (2003). “Welfare reform, labor supply, and health insurance in the immigrant population”. Journal of Health Economics. 22 (6): 933–958. CiteSeerX 10.1.1.517.7531. doi:10.1016/j.jhealeco.2003.05.002. ISSN 0167-6296. PMID 14604554. S2CID 488620.
- ^ “”The First Measured Century: An Illustrated Guide to Trends in America, 1900–2000″”. Public Broadcasting Service (PBS).
- ^ Exner, Rich (July 3, 2012). “Americans under age 1 now mostly minorities, but not in Ohio: Statistical Snapshot”. The Plain Dealer. Retrieved July 29, 2012.
- ^ “Non-white births outnumber white births for the first time in US”. The Daily Telegraph. May 17, 2012.
- ^ Bureau, U.S. Census. “American FactFinder – Results”. Factfinder2.census.gov. Archived from the original on February 12, 2020. Retrieved October 3, 2017.
- ^ a b Jacqueline Howard (January 10, 2019). “US fertility rate is below level needed to replace population, study says”. CNN.
- ^ T.J. Mathews, M.S.; Brady E. Hamilton, Ph.D (January 10, 2019). “Total Fertility Rates by State and Race and Hispanic Origin: United States, 2017” (PDF). Centers for Disease Control and Prevention.
- ^ Sabrina Tavernise (June 20, 2018). “Fewer Births Than Deaths Among Whites in Majority of U.S. States”. The New York Times.
- ^ a b Marie Patino (May 15, 2019). “U.S. Births Fell to Lowest Level in 32 Years in 2018”. Bloomberg News.
- ^ a b c d A Look at the 1940 Census (PDF), United States Census Bureau, pp. 9, 10, 11, 12, 13
- ^ “Table A. Apportionment Population, Resident Population, and Overseas Population: 2020 Census and 2010 Census” (PDF).
- ^ a b c Jay Weinstein; Vijayan K. Pillai (2016), Demography: The Science of Population (Second ed.), p. 208, ISBN 9781442235212
- ^ a b c d e “Life expectancy”. Our World in Data. Retrieved August 28, 2018.
- ^ except 1918 with only 47 years
- ^ “World Population Prospects – Population Division – United Nations”. esa.un.org. Archived from the original on September 19, 2016. Retrieved August 25, 2018.
- ^ a b Frank Hobbs; Nicole Stoops (November 2002). “Demographic Trends in the 20th Century. Census 2000 Special Reports” (PDF). U.S. Census Bureau, U.S. Department of Commerce. pp. 56, 77.
- ^ “FEATURE ARTICLE 1: POPULATION BY AGE AND SEX, AUSTRALIAN STATES AND TERRITORIES”. Australian Bureau of Statistics. December 16, 2011.
- ^ “The 2012 Global Cities Index”. Retrieved January 5, 2013. {{cite journal}}: Cite journal requires |journal= (help)
- ^ “The World According to GaWC – Classification of cities 2010”. 2010. Archived from the original on October 10, 2013. Retrieved January 5, 2013.
- ^ “American cities on the rebound”. CBS News. August 5, 2011. Retrieved May 8, 2013.
- ^ https://datausa.io/profile/geo/san-juan-caguas-guaynabo-pr-metro-area/ Datausa.io. San Juan-Caguas-Guaynabo metro area. Retrieved July 1, 2020.
- ^ “Appendix A. Census 2000 Geographic Terms and Concepts – Figure A–3. Census Regions, Census Divisions, and Their Constituent States” (PDF). U.S. Census Bureau. 2000. p. 27. Archived from the original (PDF) on June 14, 2007. Retrieved February 25, 2017.
- ^ “A Breakdown of 2020 Census Demographic Data”. NPR. August 13, 2021.
- ^ “Race and Ethnicity in the United States: 2010 Census and 2020 Census”. US Census Bureau. Retrieved December 2, 2021.
- ^ a b “2010 Census Demographic Profile Summary File” (PDF). U.S. Census Bureau. Retrieved August 25, 2017.
- ^ a b c d e “About Race”. United States Census Bureau.
- ^ a b c “ACS Demographic and Housing Estimates – 2011–2015”. U.S. Census Bureau. Archived from the original on February 13, 2020. Retrieved August 26, 2017.
- ^ a b c d “Annual Estimates of the Resident Population by Sex, Age, Race, and Hispanic Origin for the United States and States: April 1, 2010 to July 1, 2017”. United States Census Bureau. June 2018. Retrieved April 29, 2019.
- ^ KATHERINE SCHAEFFER (July 30, 2019). “The most common age among whites in U.S. is 58 – more than double that of racial and ethnic minorities”. Pew Research Center.
- ^ https://factfinder.census.gov/faces/tableservices/jsf/pages/productview.xhtml?pid=DEC_10_DPAS_ASDP1&prodType=table Archived May 3, 2017, at the Wayback Machine American FactFinder. American Samoa 2010 Demographic Profile. Retrieved July 1, 2020 (archived).
- ^ https://factfinder.census.gov/faces/tableservices/jsf/pages/productview.xhtml?pid=DEC_10_DPGU_GUDP1&prodType=table Archived April 13, 2016, at the Wayback Machine
https://factfinder.census.gov/faces/tableservices/jsf/pages/productview.xhtml?pid=DEC_10_DPMP_MPDP1&prodType=table Archived November 6, 2018, at the Wayback Machine
American FactFinder. Guam / Northern Mariana Islands Demographic Profile Data (2010). Retrieved July 1, 2020 (archived). - ^ The World Factbook CIA World Factbook. U.S. Virgin Islands. Retrieved July 1, 2020.
- ^ a b National Center for Education Statistics (February 2019). “Indicator 1: Population Distribution”.
- ^ D’VERA COHN (June 26, 2014). “Falloff in births slows shift to a majority-minority youth population”. Pew Research Center.
- ^ “About Hispanic Origin”. U.S. Census Bureau. Retrieved August 26, 2017.
- ^ “Federal Register” (PDF). Retrieved September 14, 2016.
- ^ Kanell, Michael E. (November 16, 2009). “Number of veterans, October”. Atlanta Constitution-Journal. Atlanta, Georgia. pp. A6. quoting the Bureau of Labor Statistics
- ^ Davenport, Christian (April 20, 2010). “A disconnect at Magruder”. The Washington Post. Washington, DC. pp. B1.
- ^ Hsu, Spencer S. (May 2, 2010). “Senate Democrats’ plan highlights nation’s shift to the right on immigration”. The Washington Post. Washington, DC. pp. A3.
- ^ “How European and U.S. unauthorized immigrant populations compare”. Pew Research Center. Retrieved January 7, 2020.
- ^ Gerson, Michael (January 5, 2010). “Column:More second chances”. Florida Today. Melbourne, Florida. pp. 7A.
- ^ “2012 National Population Projections: Summary Tables – People and Households – U.S. Census Bureau – Table 6: Percent Distribution of the Projected Population by Race and Hispanic Origin for the United States: 2015 to 2060 (middle series)”. Census.gov. Archived from the original on September 15, 2014. Retrieved December 7, 2017.
- ^ “Table 4. Projections of the Population by Sex, Race, and Hispanic Origin for the United States: 2010 to 2050”. U.S. Census Bureau. Archived from the original (Excel) on March 27, 2010. Retrieved October 24, 2010.
- ^ “U.S. Hispanic population to triple by 2050”. USA Today. |date=February 11, 2008}}
- ^ “White Americans no longer a majority by 2042”. Archived from the original on August 24, 2008.
- ^ Aizenman, N.C. (August 13, 2008). “U.S. to Grow Grayer, More Diverse”. The Washington Post. Retrieved May 8, 2013.
- ^ Passel, Jeffrey (February 11, 2008). “Pew Research Center: Immigration to Play Lead Role In Future U.S. Growth”. Pewresearch.org. Archived from the original on January 3, 2010. Retrieved May 8, 2013.
- ^ “Whites to become minority in U.S. by 2050”. Reuters. February 12, 2008.
- ^ Archived copy at the Library of Congress (September 17, 2008)., U.S. Census Press Releases, August 14, 2008 (archived from the original on August 22, 2008)
- ^ “The Majority of American Babies Are Now Minorities”. Bloomberg. July 25, 2015.
- ^ a b c d “United States Population 2018”, World Population Review
- ^ Jeffrey S. Passel; D’Vera Conh (February 11, 2008), U.S. Population Projections: 2005–2050
- ^ “United Nations, Department of Economic and Social Affairs, Population Division (2019). World Population Prospects 2019”. 2019. Retrieved August 21, 2019.
- ^ “2000 Census information on Gay and Lesbian Couples”. gaydemographics.org. Archived from the original on July 1, 2009.
- ^ Gary J. Gates “Same-sex Couples and the Gay, Lesbian, Bisexual Population: New Estimates from the American Community Survey” (PDF). Archived from the original (PDF) on July 2, 2007. (2.07 MB). The Williams Institute on Sexual Orientation Law and Public Policy, UCLA School of Law October 2006. Retrieved April 20, 2007.
- ^ Gates, Gary. “How many people are lesbian, gay, bisexual, and transgender?” (PDF). The Williams Institute, UCLA School of Law. Retrieved February 24, 2019.
- ^ “Research 4M adults in US identify as gay”. Florida Today. Melbourne, Florida. March 1, 2011. pp. 1A.
- ^ a b “PLACE OF BIRTH FOR THE FOREIGN-BORN POPULATION IN THE UNITED STATES. Universe: Foreign-born population excluding population born at sea more information. 2017 American Community Survey 1-Year Estimates”. United States Census Bureau. Archived from the original on February 14, 2020. Retrieved August 6, 2019.
- ^ Elijah Alperin; Jeanne Batalova (August 1, 2018). “European Immigrants in the United States – Immigration Pathways and Naturalization”. Migration Policy Institute.
- ^ “HOW ARE WE COUNTED?”. American Citizens Abroad. April 2017. Retrieved September 22, 2019. The Federal Voting Assistance Program (FVAP) estimates that there are 4.5 million to 6.5 million overseas Americans while the State Department’s most recent calculation (April 2015) of US citizens living overseas is 8.7 million{…}US citizens living outside the US who are not employed by the US Government, including dependents living with them – Not counted in the census.
- ^ These are our Numbers: Civilian Americans Overseas and Voter Turnout Archived October 24, 2013, at the Wayback Machine, By Dr. Claire M. Smith (Originally published: OVF Research Newsletter, vol. 2, issue 4 (Aug), 2010)
- ^ Trow, Steve; Bruce, Charles (March 26, 2007). “U.S. Citizens Who Don’t Know It” (PDF). Legal Times. 30 (13). Retrieved November 3, 2014.
- ^ “Measuring Religion in Pew Research Center’s American Trends Panel”. Measuring Religion in Pew Research Center’s American Trends Panel | Pew Research Center. Pew Research Center. January 14, 2021. Archived from the original on February 8, 2021. Retrieved February 9, 2021.
- ^ Table No. 68. Religious Bodies – Selected Data (p. 59), “Statistical Abstract of the United States: 2004–2005 (tables 67–69)” (PDF). U.S. Census Bureau.
- ^ “Statistical Abstract of the United States: 2004–2005 (tables 67–69)” (PDF). U.S. Census Bureau.
- ^ “Statistics on Religion in America Report – Pew Forum on Religion & Public Life”. Pewforum.org.
- ^ “America’s Changing Religious Landscape”. Pewforum.org. Pew Research Center’s Religion & Public Life Project. May 12, 2015. Retrieved October 9, 2016.
- ^ “In U.S., Decline of Christianity Continues at Rapid Pace”. Pewforum.org. October 17, 2019. Retrieved October 19, 2019.
- ^ “GLOBAL RELIGIOUS FUTURES A PEW-TEMPLETON PROJECT”. PEW RESEARCH. Archived from the original on May 3, 2013.
- ^ a b American Baptist Association – Membership Data Association of Religion Data Archives
- ^ SUMMARY OF DENOMINATIONAL STATISTICS American Baptist Churches U.S.A.
- ^ a b c AG Churches, Membership, Adherents and Ministers 1960–2018 ag.org
- ^ a b c Baptist Bible Fellowship International – Membership Data Association of Religion Data Archives
- ^ a b Baptist Missionary Association of America – Membership Data Association of Religion Data Archives
- ^ “Disciples of Christ Claim Distinction of Fastest Declining Church”. Retrieved November 14, 2019.
- ^ a b “Church of the Brethren denominational membership falls below 100,000”. Church of the Brethren Newsline. January 27, 2021. Retrieved March 9, 2021.
- ^ a b CHURCHES OF CHRIST in the UNITED STATES – Statistical Summary 21stcc.com
- ^ a b “Table of Statistics of the Episcopal Church From 2018 Parochial Reports” (PDF). episcopalchurch.org. 2018. Archived from the original (PDF) on September 5, 2019. Retrieved September 9, 2019.
- ^ a b “ELCA Facts”. elca.org. Evangelical Lutheran Church in America. Archived from the original on September 25, 2016. Retrieved August 16, 2019.
- ^ “About the EPC | EPC”. epc.org.
- ^ a b c Greek Orthodox Archdiocese of America – Membership Data Association of Religion Data Archives
- ^ a b c “The Lutheran Church – Missouri Synod Facts”. Retrieved June 9, 2019.
- ^ a b c National Association of Free Will Baptists – Membership Data Association of Religion Data Archives
- ^ a b c d Statistics Archived September 27, 2019, at the Wayback Machine Baptist World Alliance
- ^ a b c Orthodox Church in America – Membership Data Association of Religion Data Archives
- ^ “PCA Statistics Five Year Summary”. PCA Administrative Committee.
- ^ a b “Statistics PCUSA 2018” (PDF). Retrieved June 3, 2019.
- ^ (PDF) https://www.pcusa.org/site_media/media/uploads/oga/pdf/2020_comparative_stats.pdf. {{cite web}}: Missing or empty |title= (help)
- ^ Church Statistical Data Reformed Church in America
- ^ “Adherents.com”. Adherents.com. Archived from the original on October 3, 2003. Retrieved September 19, 2011.{{cite web}}: CS1 maint: unfit URL (link)
- ^ “Section 1. Population” (PDF). Statistical Abstract of the United States: 2004–2005. U.S. Census Bureau. p. 55. Retrieved June 29, 2008. (Table No. 67. Self-described religious identification of adult population: 1990 and 2001; data for 2001).
- ^ a b “Southern Baptist Convention continues statistical decline, Floyd calls for rethinking ACP process”. Baptist Press. Retrieved June 8, 2020.
- ^ “UMData”. www.umdata.org.
- ^ a b “2019 WELS Annual Report”. Wisconsin Evangelical Lutheran Synod. Retrieved July 23, 2019.
- ^ By 2040, Islam will be second largest religion in US: Study, Hindustan Times, January 12, 2018.
- ^ a b Barry A. Kosmin and Ariela Keysar (2009). “American Religious Identification Survey (ARIS) 2008” (PDF). Hartford, Connecticut, USA: Trinity College. Archived from the original (PDF) on April 7, 2009. Retrieved April 1, 2009.
- ^ a b c d e “Religion in America: U.S. Religious Data, Demographics and Statistics”. Pew Research Center. Retrieved October 19, 2019.
- ^ a b “S1501 – EDUCATIONAL ATTAINMENT”. U.S. Census Bureau. Archived from the original on January 22, 2019. Retrieved October 17, 2019.
- ^ a b c d e f “DP03 – SELECTED ECONOMIC CHARACTERISTICS”. U.S. Census Bureau. Archived from the original on February 14, 2020. Retrieved October 17, 2019.
- ^ Schuman, H. and Scott, J. (1989), Generations and collective memories, American Sociological Review, vol. 54, 1989, pp. 359–81.
- ^ Deane, Claudia (December 15, 2016). “Americans Name the 10 Most Significant Historic Events of Their Lifetimes”. Pew Research Center. Retrieved April 12, 2019.
- ^ a b c d e Dimock, Michael (January 17, 2019). “Defining generations: Where Millennials end and Generation Z begins”. Pew Research Center. Retrieved April 12, 2019.
- ^ “People: The Younger Generation”. Time.com. November 5, 1951. Archived from the original on September 13, 2012.
- ^ Miller, Jon D. “The Generation X Report: Active, Balanced, and Happy: These Young Americans are not bowling alone” (PDF). University of Michigan, Longitudinal Study of American Youth, funded by the National Science Foundation. Retrieved October 30, 2012.
- ^ Encyclopedia of Identity By Ronald L. Jackson, II
- ^ Williams, Alex (September 19, 2015). “Meet Alpha: The Next ‘Next Generation'”. Fashion. The New York Times. Retrieved September 7, 2019.
- ^ Tuttle, William M. (1993). “Daddy’s Gone to War”: The Second World War in the Lives of America’s Children. Oxford University Press, US. p. 25. ISBN 9780195096491. Retrieved March 17, 2014.
- ^ a b c d e f g Bureau, US Census. “COVID-19, Declining Birth Rates and International Migration Resulted in Historically Small Population Gains”. Census.gov. Retrieved February 16, 2022.
- ^ a b c “Provisional number of marriages and marriage rate, divorces and annulments and rate, 2000-2020” (PDF). CDC/NCHS National Vital Statistics System. Archived (PDF) from the original on February 16, 2022. Retrieved February 16, 2022.
- ^ “Marriage rates by State: 1990, 1995, and 1999-2019” (PDF). CDC/NCHS, National Vital Statistics System. Archived (PDF) from the original on February 14, 2022. Retrieved February 16, 2022.
- ^ Amy Sullivan (March 20, 2009). “Behind the Boom in Adult Single Motherhood”. Time.com. Archived from the original on March 22, 2009.
- ^ “Blacks rank highest in unwed births”. Florida Today. Melbourne, Florida. November 7, 2010. pp. 9A.
- ^ “Births to unmarried women, by race and Hispanic origin of mother: United States, each state and territory, 2020” (PDF). National Vital Statistics Reports Volume 17, Number 70, March 7, 2022. CDC. Retrieved February 16, 2022.
- ^ “Birthrate Is Lowest in a Century” Associated Press article printed in The New York Times August 27, 2010, accessed August 28, 2010
- ^ Kowlessar N.M., Jiang H.J., and Steiner C. “Hospital Stays for Newborns, 2011.” HCUP Statistical Brief #163. October 2013. Agency for Healthcare Research and Quality, Rockville, MD. http://www.hcup-us.ahrq.gov/reports/statbriefs/sb163.jsp
- ^ Roan, Shari (March 31, 2011). “Drop in U.S. birth rate is the biggest in 30 years”. Los Angeles Times.
- ^ “America’s Birth Rate Declined For The Third Year Running”. Businessinsider.com.
- ^ “America’s Birth Rate Declined For The Third Year Running”. Businessinsider.com.
- ^ “Health and Wellness”. Usatoday.com.
- ^ “Lower birth rate blamed on the economy – wzzm13.com”. Archiver.is. February 9, 2013. Archived from the original on February 9, 2013. Retrieved October 3, 2017.
- ^ a b c d “CDC Features”. Centers for Disease Control and Prevention. June 27, 2019. Archived from the original on July 4, 2011.
- ^ “CDC Features – Teen Birth Rates Drop, But Disparities Persist”. Cdc.gov. March 6, 2020.
- ^ Current Unemployment Rates for States and Historical Highs/Lows, U.S. Bureau of Labor Statistics
- ^ Frey, William H. (January 11, 2021). “REPORT: What the 2020 census will reveal about America: Stagnating growth, an aging population, and youthful diversity”. Brookings Institution.
- ^ a b c “Seasonally Adjusted Unemployment Rate”. U.S. Dept. of Labor. Retrieved September 19, 2016.
- ^ “Employment Situation Summary”. U.S. Dept. of Labor. July 2, 2015. Retrieved December 26, 2015.
- ^ “Table A-15. Alternative measures of labor underutilization”. U.S. Bureau of Labor. Retrieved November 13, 2011.
- ^ Rickard, Stephanie J. (2020). “Economic Geography, Politics, and Policy”. Annual Review of Political Science. 23: 187–202. doi:10.1146/annurev-polisci-050718-033649.
- ^ Bureau, US Census. “Census Bureau Releases 2021 CPS ASEC Geographic Mobility Data”. Census.gov. Retrieved March 3, 2022.
External links
| Wikimedia Commons has media related to Demographics of the United States. |
- Bureau du recensement des États-Unis
- New York Times : “Cartographie du recensement américain de 2010”
- Recensement de la population et du logement de 2000 États-Unis , US Census Bureau
- Asian-Nation : Démographie des Américains d’origine asiatique /2006-07-04-us-population_x.htm?csp=34 Compte à rebours jusqu’à 300 millions
- Carte d’ascendance du recensement
- USA Today 2004 Élection Comté par comté Carte
- Google – données publiques « Population aux États-Unis »